Thursday, December 27, 2018

log4j-aws-appenders now supports Logback

I started my Log4J appenders project because I wasn't happy with how the AWS CloudWatch agent broke apart logfiles. It seemed, as I said in the FAQ, like it would be an easy weekend project. That was nearly two years ago.

In the interim, I added support for Kinesis Streams (a year ago) to support search-engine-based centralized logging using AWS managed Elasticsearch. Surprisingly, it wasn't until after that implementation effort that I truly “bought into” the benefits of using a search engine to examine logs. Now I can't imagine going back to grep.

After giving a talk on centralized logging to the local Java users' group, some of the feedback that I got was “it's nice, but we're not using Log4J 1.x.” So in the early fall I started to break the library into pieces: a front-end that's tied to a particular logging framework, and a back-end that handles communication with AWS. This turned out to be quite easy, which I think means that I had a good design to start with.

Then it was a matter of picking another logging framework, and learning enough about it to be able to implement appenders. I picked Logback because it's the default logging framework for Spring, and because it's the native back-end for SLF4J (which I've been using with Log4J for around five years now).

One of the interesting things that came out of this work is that I now see a good use case for multiple inheritance. There's an enormous amount of duplicated code because each appender has two is-a relationships: one to the logging framework and another to the back end. It would be nice if Java had something like Scala traits, where each trait would encapsulate one of the is-a relationships, and the appender would just be a combination of traits. On the other hand, I've seen enough ugly code using traits that I still think Gosling et al made the right decision.

Log4J 2.x is up next, although I think I'm going to take a break for a few months. I have several other projects that have taken a back seat, including a library of AWS utility classes that I started a year ago and hasn't seen its first release.

Happy Holidays!

Sunday, December 16, 2018

Database Connection Pools Need To Evolve

I never thought very deeply about connection pools, other than as a good example of how to use phantom references. Most of the projects that I worked on had already picked a pool, or defaulted their choice to whatever framework they were using. It is, after all, a rather mundane component, usually hidden behind the object relational manager that you use to interact with your database.

Then I answered this Stack Overflow question. And, after playing around a bit and writing a much longer answer, I realized that connection pools — even the newest — have been completely left behind by the current best practices in database management. Two of those practices, in particular:

  • Database credentials should be handled with care

    All of the pools that I've used expect you to provide database credentials in their configuration. Which means that you, as a security-conscious developer, need to retrieve those credentials from somewhere and manually configure the pool. Or, as a not-so-security-conscious developer, store them in plain text in a configuration file. In either case, you're doing this once, when the application starts. If there's ever a need to change credentials, you restart your application.

    That makes it difficult to practice credential rotation, where your database credentials change on a frequent basis to minimize the impact of losing those credentials. At the extreme, Amazon's RDS databases support generation of credentials that last only 15 minutes. But even if you rotate credentials on a monthly basis, the need to restart all of your applications turns this simple practice into a major undertaking, almost certainly manual, and one that may require application downtime.

  • Failover isn't a big deal

    Failover from primary database to replica has traditionally been a Big Event, performed manually, and often involving several people on a conference call. At a minimum you need to bring up a new replaca, and with asynchronous, log-based replication there is always the chance of lost data. But with modern cluster-based database servers like Amazon Aurora, failover might happen during unattended maintenance. If the application can't recognize that it's in the middle of a short-duration failover, that's means it's still a Big Deal.

One solution to both of these problems is for the pool to provide hooks into its behavior: points where it calls out to user code to get the information it needs. For example, rather than read a static configuration variable for username and password, it would call a user-defined function for these values.

And that's fine, but it made me realize something: the real problem is that current connection pools try to do two things. The first is managing the pool: creating connections, holding them until needed, handing them out, collecting them again when the application code forgets to close them, and trying to do all of this with the minimal amount of overhead. The second task is establishing a connection, which has subtle variations depending on the database in use.

I think that the next evolution in connection pools is to separate those behaviors, and turn the connection management code into a composable stack of behaviors that can be mixed and matched as needed. One person might need a MySQL connection factory that uses an IAM credentials provider and a post-connection check that throws if the database is read-only. Another person might want a Postgres connection factory that uses an environment-based credentials provider and is fine with a basic connection check.

The tricky part is deciding on the right interfaces. I don't know that the three-part stack that I just described is the right way to go. I'm pretty sure that overriding javax.sql.DataSource isn't. And after creating an API, there's the hard work of implementing it, although I think that you'll find a lot of people willing to contribute small pieces.

The real question: is there a connection pool maintainer out there who thinks the same way and is willing to break her pool into pieces?

Saturday, December 8, 2018

Using CloudWatch Insights With JSON Log Messages

I've never been a fan of CloudWatch Logs. On the positive side, it's available by default, is relatively cheap, and there are a variety of ways to send data to it (including my own log4j-aws-appenders). But the features it supported were extremely limited: you could view log messages by date/time range or do a simple text search. As a result, I felt that “serious” log analysis required a tool like Kibana, fed by a Kinesis-based pipeline. Or, if your volumes were low enough, a service provider such as Loggly or DataDog.

That opinion changed with the introduction of CloudWatch Logs Insights. This feature adds a query tab to the CloudWatch Logs console, allowing you to filter and summarize messages. For example, this query will show you the number of messages that contain the word “ERROR” (from your selected time range, which is specified outside of the query):

filter @message like /ERROR/
| stats count()

To actually see those errors, you'd replace the stats directive with fields, along with a sort to put them in reverse chronological order:

filter @message like /ERROR/
| fields @@timestamp, @message
| sort @timestamp desc

That's nice, but it's still full-text search: if you're using Log4J it will pick up the messages that were logged at the ERROR level, but it will also pick up any other entries that happen to contain the word “ERROR” anywhere in the message.

But Insights isn't limited to simple text searches on the entire message: it will parse JSON messages and let you reference individual fields from those messages. And, as it happens, my appenders library provides a JSON layout class (originally intended for the Kinesis to Kibana pipeline linked above). To configure the CloudWatch appender with the JSON layout, you'd add these lines to your log4j.properties file (changing logGroup, logStream, and tags as appropriate):

log4j.appender.cloudwatch=com.kdgregory.log4j.aws.CloudWatchAppender
log4j.appender.cloudwatch.logGroup=AppenderExample
log4j.appender.cloudwatch.logStream={date}-{hostname}-{pid}
log4j.appender.cloudwatch.layout=com.kdgregory.log4j.aws.JsonLayout
log4j.appender.cloudwatch.layout.tags=applicationName=Example,runDate={date}
log4j.appender.cloudwatch.layout.enableHostname=true
log4j.appender.cloudwatch.layout.enableLocation=true

As I said, you can use individual fields from the JSON message in your queries. So to see only the Log4J errors, you would use the following (note: this uses the parsed “message” field, which is different from the unparsed “@message” field):

filter level == "ERROR"
| fields @timestamp, logger, message
| sort @timestamp desc
| limit 25

You can also aggregate the data. For example, this query counts the number of errors for each 15 minute period within your time range:

filter level == "ERROR"
| stats count() by bin(15m)

There are, of course, some caveats to this feature. While the documentation doesn't go into detail, it appears to work by a brute-force scan all of your log messages (unlike Kibana, which uses a search engine to index the messages). This means that queries take longer to run, and that time increases with the amount of data that you're examining.

You'll also pay (as of the time of writing) $0.005 per gigabyte of data scanned. This is cheap if you are careful to restrict your time periods and/or don't have a lot of logging output. But I suspect it will add up quickly.

With those caveats, however, I think Insights is a great solution for organizations that don't have large logging volumes, don't want to ship their logs offsite, and don't want to pay for an Elasticsearch/Kibana cluster.

Monday, August 27, 2018

(Poor) EFS Performance for Software Builds

Elastic File System (EFS) is, on the surface, a nice addition to the AWS storage options: based on the long-lived Networked File System (NFS), it lets you share a single volume between multiple EC2 instances. It also has the benefit that you only pay for what you actually use: while more expensive than Elastic Block Store (EBS), you don't have to pay for provisioned-but-unused capacity.

The dark side of EFS is performance. Unlike EBS, it's not measured in IOPS, but in megabytes per second of throughput. And it's a “burstable” performance model: while you can get a peak throughput of 100 MiB/second (or higher, for volumes over a terabyte), you can't sustain that rate. Instead, you get a “baseline” rate that's dependent on your volume size, and a pool of credits that is consumed or replenished depending on whether your actual usage is above or below that baseline rate.

That, in itself, is not so bad, but the baseline rate is 50 kiB/second per gigabyte of storage. So for small volumes, you don't get much throughput at all. Since July 2018 you've been able to buy provisioned throughput, at $6 per MiB/second per month. Historically, the way to get higher throughput has been to create a large empty file (eg, 100 Gib gets you 5 MiB/sec; it costs the same price as equivalent provisioned throughput).

The practical outcome of this behavior is that EFS is inappropriate for many services that need high throughput with relatively small filesystem sizes (unless you buy provisioned throughput). And as a result, some some software vendors recommend against using EFS with their software (for example, Atlassian BitBucket and Sonatype Nexus).

That said, one of the Amazon-recommended usecases for EFS is for user homes, and this has traditionally been one of the primary usecases for shared filesystems: no matter what machine you log into, you get the same home directory. But what happens if you're a developer and run builds on the shared filesystem? Or, going one step further, is EFS an appropriate choice for the build directories of a fleet of build machines?

Several years ago, I compared the performance of hard disks and SSDs for builds. The outcome of those experiments was that there was a negligible (11%) difference, because software builds are generally CPU-bound rather than IO-bound. So does the same logic apply to building on EFS?

To come up with an answer, I spun up an m5d.xlarge EC2 instance. This instance has 4 virtual CPUs and 16 Gb of RAM, so is a decent representative build machine. More important, it has 150 Gb of NVMe instance storage, so I figured it would be a good comparison for a similarly-sized developer PC. It was running Amazon Linux 2 (ami-04681a1dbd79675a5) along with OpenJDK 1.8 and Maven 3.5.4.

I also ran the compile tests on my personal PC, which features a Core i7-3770k CPU at 3.5 GHz, 32 GB of RAM, and a Samsung 850 Pro SSD; it runs Xubuntu 18.04, Oracle JDK 8, and Maven 3.5.2. It's now five years old, but is still a competent development box, so I figured would give me a baseline to compare to running in the cloud.

I did builds with two pieces of software: the AWS Java SDK (tag 1.11.394) and my Log4J AWS appenders project. The former is huge: 146 sub-projects and 39,124 Java source files; it represents a deployable application (although, really, is far larger than most). The latter is much smaller; with 64 source files, it's meant to represent a module that might be used by that application.

In both cases I built using mvn clean compile: I didn't want a slow-running test suite to interfere with the results. My experimental process was to flush the disk cache (see my prior post for how to do that), clone the source repository, run a first build to download any dependencies, flush caches again, then run the timed build. I also timed the clone when running on EC2; I didn't for my PC because it would be limited by the speed of my network connection.

To avoid any cross-contamination, I created a separate user for each mounted volume, so all parts of the build would be touching that volume and no other. Here are the details:

  • local: uses 150Gb SSD storage physically attached to virtual machine, formatted as ext4
  • ebs: an external EBS volume (so that there wouldn't be contention with the root volume), formatted as ext4
  • efs: an EFS filesystem endpoint from the same availability zone as the EC2 instance. It was mounted using the Amazon-recommended set of mount options.
  • efs-remote: an EFS filesystem with an endpoint in a different availability zone, to see if cross-AZ connections introduced any lag. As with the efs volume, this volume was also manually mounted, because the EFS Mount Helper will refuse to mount a volume that doesn't have an endpoint in the current AZ).
  • nfs: to see if there were overheads introduced by EFS on top of the NFS protocol, I spun up an m5d.large instance in the same availability zone as my test machine, formatted its instance store as ext4, and exported that volume using NFS. The export options were (rw,sync,insecure,no_root_squash,no_subtree_check,fsid=0), and the mount options were identical to those used for EFS.

One important note: the EFS filesystems were created just for this test. That means that they had a full credit balance, and the ability to run at 100 MiB/sec throughput for the entire test. In other words, it presented the peak of performance from an EFS filesystem.

Here are the results. Each column is a task, each row is a filesystem type, and the three numbers in each cell are the results from the Linux time command: real, user, and system. Real time is the total amount of time that the step took; it's what most people care about. User time is CPU time; Maven can make use of multiple cores, so this is usually higher than real time. System time is time spent in the kernel; I think of it as a proxy for the number of system calls. All times are represented as MINUTES:SECONDS, with fractional seconds rounded up (I don't see benefit to half-even rounding here).*

  AWS Java SDK - clone AWS Java SDK - build AWS Appenders - clone AWS Appenders - build
Desktop PC   01:21 / 02:20 / 00:08   00:03 / 00:09 / 00:01
Instance Store 01:21 / 02:47 / 00:08 07:44 / 20:17 / 00:08 00:01 / 00:01 / 00:01 00:18 / 00:56 / 00:01
EBS 01:21 / 02:47 / 00:09 08:14 / 21:58 / 00:08 00:01 / 00:01 / 00:01 00:18 / 00:56 / 00:01
EFS Same AZ 18:01 / 02:48 / 00:15 33:05 / 19:18 / 00:17 00:08 / 00:01 / 00:01 00:29 / 01:11 / 00:01
EFS Cross AZ 19:16 / 02:49 / 00:13 35:17 / 18:36 / 00:17 00:08 / 00:01 / 00:01 00:30 / 01:08 / 00:01
NFS 02:17 / 02:48 / 00:12 08:56 / 22:42 / 00:19 00:01 / 00:01 / 00:01 00:18 / 00:55 / 00:01

The first surprise, for me, was just how poorly the EC2 instance performed compared to my destop. According to Amazon's docs, an M5 instance uses “2.5 GHz Intel Xeon® Platinum 8175 processors”: several generations newer than the Core i7 in my PC, but running at a lower clock rate. If we assume that my CPU is able to use “Turbo Boost” mode at 3.9 GHz, then the EC2 instance should be roughly 2/3 as fast based just on clock rate. Which should mean that builds might take twice as long, but definitely not five times as long.

I have no idea what accounts for the difference. That same EC2 doc says that “Each vCPU is a hyperthread of an Intel Xeon core,” so the four vCPUs of the EC2 instance are not the same as the four physical cores (8 hyperthreads) of my PC, and perhaps that's the cause. The ratio between real and CPU time is certainly higher on the EC2 instance, and the difference in number of cores could compound with the difference in CPU clock rate. Other things that I thought of were having more memory in my PC, leading to a larger buffer cache, but 16GB should have been more than enough for the jobs that I ran. Another possibility was a “noisy neighbor” on the same physical hardware as the EC2 instance, but I re-ran these tests after stopping and restarting the instance (so it was deployed on multiple physical machines). This is a topic for more experiments, but in the meantime I now question the wisdom of developing in the cloud.

The (lack of) performance difference between instance store and EBS wasn't surprising: it basically reiterated the results of my former post, in which I found that drive performance had little effect on compile times. While NVMe instance store may be far faster than EBS in absolute performance, you need a workload that can exploit that. And building isn't it.

The real stunner, however, was how badly EFS performed, especially compared to NFS. To be truthful, it was expected: the reason I ran these tests was seeing unexpectedly poor performance from a build machine.

When I first saw the performance problems, I thought it was due to the NFS protocol, which is based on a filesystem abstraction rather than the block-store abstraction of a disk-based filesystem. But as the results show, a generic NFS server can perform almost as well as EBS: it takes a little more time to compile, and significantly more time to check-out a large repository, but nowhere near as much as EFS.

The Amazon docs don't say much about how EFS actually works, other than “EFS file systems store data and metadata across multiple Availability Zones” and that they “allow massively parallel access” … that sounds a lot like S3 to me. I don't know if EFS is indeed a protocol layer on top of S3, but its performance compared to vanilla NFS tells me that there's a lot happening behind the scenes; it's not a traditional filesystem.

The bottom line: while there may be valid usecases for EFS, developer home directories and build-server storage aren't among them.


* I reran this test and realized that the “User” time in this table was dramatically over-reported. I was able to repeat the test with consistent numbers, so suspect this is due to an implementation detail of either the kernel or bash shell in the AMI that I used. Regardless, it should be ignored; focus on the “Real” time, which represents perceived execution time.

Saturday, August 4, 2018

The KFEK Stack: A Logging Pipeline for AWS

This post is a short introduction to building a logging pipeline based on managed services provided by AWS. I've covered this topic in a presentation for the Philadelphia Java User's Group, and in a much longer article on my website. I've also built such a pipeline, aggregating log messages from (when I left the company) a 200 machine production environment that generated 30 GB of log messages per day.

I'll start with a quick review of why log aggregation is a Good Thing, especially in a cloud deployment:

  • You may have many machines writing logs.

    To inspect those logs you either need to go to the machines themselves, pull the logs to your workstation, or push them to a centralized location. And your system operations group may have very strong feelings about some of these options.

  • You may have many machines running the same application.

    To track down a problem, you will have to examine multiple logfiles, and be able to identify which machine they came from.

  • You may need to correlate log messages from different applications.

    This is a particular problem in a micro-service architecture: your web requests may fail due to a remote service, meaning that you have to correlate logs from different machines.

  • Machines regularly shut down.

    The promise of cloud deployments is that you can scale-up and scale-down in response to actual load. However, scaling down means terminating the instance, and that means losing all files that haven't been retrieved or pushed to a central location.

There are many ways to approach centralized logging. One of the simplest — and for a small deployment, arguably best — is to ship your logs off to a third-party provider, such as Loggly or SumoLogic. They make it easy to start with centralized logging, providing useful tools at a very reasonable price. The downside is that, as your logging volumes increase, you may move into their “call us” pricing plans.

The standard self-managed solution is the “ELK” stack: Elasticsearch, Logstash, and Kibana. All are products of elastic, which provides these three products in open source versions and makes their money from paid enhancments and consulting.

In my eyes, there are two primary drawbacks to deploying the ELK stack. The main one is that you have to deploy it — and possibly wake up in the middle of the night when one of the nodes in your Elasticsearch cluster goes down. This drawback is answered by Amazon Elasticsearch Service, a managed implementation of Elasticsearch and Kibana. It allows you to bring up or reconfigure an Elasticsearch cluster with a few mouse clicks in the console, and the AWS ops team will fix any failed hardware for you. In exchange, you pay slightly more than a self-hosted solution, and give up some flexibility. For me that's a good deal.

The second drawback to the ELK stack is the “L”: Logstash, and its companion, Filebeat. To make the ELK stack work, you need to install an agent on each machine: that agent looks at local logfiles, parses them, and ships a JSON representation off to Elasticsearch. This isn't too onerous, as long as you format your logfiles to match one of the out-of-the-box formats, but if you don't you need to write regexes. And you need to manage the on-host logfiles, using a tool like logrotate.

My solution is to have applications write JSON-formatted messages to a Kinesis Data Stream, where they are picked up and sent to Elasticsearch via Kinesis Firehose.

The chief benefit of this architecture — aside from not installing log agents or being woken up in the middle of the night — is scalability. A Kinesis Stream is built from shards, and each shard can accept 1,000 messages or 1 MB per second. As your logging volume increases, you can add shards as needed. Firehose will accommodate the increased throughput by writing to Elasticsearch more frequently. And if you start pushing the limits of your Elasticsearch cluster, you can expand it from the AWS Console.

There is one question remaining: how do the applications write directly to the Kinesis stream? It's actually a rather challenging problem, as writers need to use bulk APIs for performance, but be prepared to resend individual messages. My solution, since I come from a background of Java and Log4J, was to write a Log4J appender library (which also supports other AWS destinations). But I'm not the only person who has had this idea; Googling turned up implementations for Python, .Net, and other languages (I haven't tried them, so am not linking to them).

To recap: if you have a few dozen machines, you'll probably find third-party log aggregators a cost-effective, easy solution. But if your logging volumes are high enough to warrant the cost, this pipeline is an effective alternative to a self-managed ELK stack.

Monday, March 19, 2018

Moving from EC2-Classic to VPC

If you're a long-time user of Amazon Web Services, chances are good that your application runs in “EC2-Classic”: the original AWS offering, where each server has a public IP on the open Internet. In 2011 Amazon introduced Virtual Private Cloud (VPC), in which your instances live on an isolated network using non-routable (private) IP addresses. At the end of 2013, Amazon made VPC the default deployment environment; if you created your AWS account in 2014 or later, you can stop reading now.

So, let's assume that you have applications deployed in EC2-Classic. Why would you want to move them to the VPC? Here are a few of the reasons that are important to me:

  • Minimize attack surface
    In EC2-Classic your instances have a public IP, and rely on security groups to control access. And while I'm not aware of any case where a properly configured security group has failed to prevent access, it's far too easy to accidentally open ports. On a private subnet, there is no direct route from the Internet to the instance, so opening a port has less potential for harm (although it's still to be avoided).
  • Control user access
    In addition to access by the general public, a VPC with private IPs and a Bastion host gives you greater control over access by your own people — or, more correctly, by their computers. If one of your employees loses his or her laptop, it's easier to disable that laptop's private key on a single bastion host rather than dozens or hundreds of externally-exposed application servers.
  • Control application access -- separate test and prod
    If you're running in EC2-Classic, the only thing that keeps a test server from updating a production database is its configuration. If test and prod have their own VPC, misconfiguration doesn't matter (unless you intentionally link the two VPCs).
  • Reduce cost of communication
    As I've said elsewhere, Amazon's data transfer pricing is complex, depending on where the traffic originates or terminates. But in general, communication via public IP is more expensive than via private IP. The savings may be only pennies per gigabyte, but they do add up.
  • Simplify whitelisting with external providers
    This was a big issue for my last company: several of our providers would only accept traffic from whitelisted IPs. That was solvable with Elastic IPs, but meant that we had to acquire an unattached IP from our pool when starting an instance (which meant that there had to be unused IPs in the pool, and unused Elastic IPs have a per-hour charge). With the VPC, we run everything through NATs with permanently assigned public IPs. To add another provider that requires whitelisting is a matter of telling them the existing NAT IPs; there's no need to provision additional Elastic IPs.

So, assuming these arguments are persuasive, how do you proceed?

Step 0: Pick a tool

My last post was about the benefits to using generated templates for application deployment. I think that the same arguments apply to infrastructure deployments, although there is less benefit to writing a program to generate the deployment script. There is still some benefit: you'll want to create production and test environments with slight variations, and you can play some bit-mapping tricks to associated availability zones with CIDRs (see below). But a lot of VPC configuration consists of one-off resource definitions, and you won't be running your VPC script more than a few times.

I think that the main reason to use a tool — at least, one that supports comments — is to provide documentation, which includes version-control history. Although your VPC won't change much over its lifetime, it will change.

Step 1: Architect your VPC

Amazon provides you with a default VPC in each region, and a lot of people start using that VPC without giving it a lot of thought. Unfortunately, that default VPC is almost certainly not optimal for your deployments; for one thing, all of the subnets are public, which means that you either assign a public IP to the instances running there or they can't talk to the outside world. A better approach, in my opinion, is to think about your workloads and plan the network accordingly before building. Here are a few of the things that I think about:

  • What CIDR block should you use?

    Amazon recommends creating VPCs that use non-routable IP addresses from one of the defined private subnet ranges. They allow you to create VPCs that cover public, routable IP addresses, but I think the only reason that you'd want to do that is to incorporate the VPC into your existing network. Don't do it unless you know that you need to.

    A more interesting question is which of the private address ranges should you use? To a large extent, I think this depends on what you're already using as a corporate network, because you want addresses on the VPC to either (1) be completely different than the corporate network, or (2) occupy a defined range of the corporate network. So, if you have a corporate network that uses 10.x.x.x addresses, you should either ask your IT department for a block of those addresses, or configure the VPC to use 172.x.x.x addresses. For the sake of the people who work from home, please don't be tempted to use a 192.168.x.x address.

    While you can define the VPC to use less than a /16 network address, the only reason to do so is to fit into an existing corporate standard. If that's not the case, then don't limit youself unnecessarily.

  • How many availability zones do you need?

    Amazon does not actually define what, exactly, an availability zone is; the conventional understanding is that each availability zone corresponds to a data center. What they are clear about is that an availability zone can become unavailable, and that has happened multiple times in Amazon's history. To prevent a single-AZ event from taking down your applications, you want to deploy into at least two zones.

    But should you configure your VPC with more than two zones? There have been multi-AZ failures in the past, but the only real way to keep running through those is to adopt multi-region redundancy. A bigger issue is one of capacity: while you can probably expect to get as many t2.small instances as you want, some of the larger instance types may have temporary or longer-term shortages in a particular AZ; if you have a limited number of AZs this may prevent you from deploying a workload. I've experienced this with compute-intensive elastic map-reduce clusters, and you can see the difference if you look at spot price history: on any given day you might see a 20 or 30 cent difference in the price of a c5.4xlarge instance between AZs.

    On the other hand, more AZs may mean a more complex or more expensive infrastructure. For example, if you use one NAT per AZ, your costs rise linearly with number of AZs; if you share a NAT, you have to manage the separate routing tables for AZs with and without NATs (and pay for cross-AZ traffic).

  • How many subnets do you need, and how big should they be?

    I'm going to assume that you'll have at least two subnets per availability zone: one public and one private. But do you need more? Some people like to group applications by subnet, and will divide up their address space with one subnet per application. I that's at least partly a historical artifact of physical networking constraints: when computers are connected by wires and switches, you isolate traffic using subnets. In the AWS world traffic management isn't your concern: routing is handled by the AWS infrastructure and you have no idea how individual instances are physically connected.

    My personal belief is to give your subnets as much space as they can get. For example, you can divide a /16 VPC into four /18 subnets, each of which will support 16,379 hosts (why not 16,384? the answer is that AWS reserves five addresses from each subnet — another reason to not use small subnets). Since you want a public and private subnet for each AZ, you could further subdivide one of the /18 address spaces, giving four /20 address subnets (this makes sense because public subnets will have far fewer hosts than private).

    This sort of division makes programmatic generation of subnets easy: starting with a /16 base address you use the four high-order bits of the third byte to encode availability zone and public/private. For example: in the us-east-1 region you assign the number 0 to us-east-1a, 1 to us-east-1b, and 2 to us-east-1c. The public subnet in us-east-1a would have a third byte 1100xxxx, while the private subnet in that availability zone would use 00xxxxxx; for us-east-1b, public would be 1101xxxx and private 01xxxxxx; for us-east-1c, 1110xxxx and 10xxxxxx (and yes, that leaves a /18 subnet with 1111xxxx).

  • NAT Instance or NAT Gateway?

    I've covered this pretty deeply here. If you don't know that you're going to be pushing a lot of data over the NAT, then I think it's best to start with a NAT Gateway and let Amazon manage it for you. For redundancy you should have one NAT per availability zone, but if you're willing to accept downtime (and cross-AZ data charges) you can save money with a single NAT.

Step 2: Move your applications

At this point you have a lot of resources in EC2-Classic and an empty VPC. If you can afford downtime you can do a mass move and be done with it. Most of us can't afford the downtime, so we have to move our resources in phases. And you'll be faced with a question: do you move the app-servers first or the databases. The answer to this question largely depends on how many app-servers you have, and what other pieces of infrastructure they need to connect to.

The problem is security groups: most deployments are configured to allow inbound traffic based on security group IDs. So, for example, you might have one security group per application, assigned to the EC2 instances, load balancer, and database for that application, which has a rule that allows traffic from itself. This is a nice clean way to control access, but it has one problem: the security groups that you define in your VPC can't reference security groups that you've defined in EC2-Classic.

There are two solutions. The first is ClassicLink: you explicitly associate the EC2-Classic instance(s) with the VPC. With a large number of instances this becomes a pain point, even though you can link an auto-scaling group rather than individual instances.

The other solution is to run your EC2 instances within the private subnet(s) and enable access to the infrastructure resources using the IP addresses assigned to the NAT. This does mean that you'll be paying for traffic over the NAT, which can add up for a busy system, but shouldn't be a long-term cost.

Step 3: Move your non-database infrastructure

Non-database infrastructure includes things like Redis caches or SOLR/ElasticSearch services. These can be (relatively) easily copied from an external server to an internal server, either as a fresh deployment or by making a snapshot of the original server's volume(s).

One of the things to consider at this time is whether or not you should continue to support these services as physical servers. For example, replacing Redis with ElastiCache. You will pay more to run as a managed service, but in many cases it makes economic sense to eliminate the responsibility of managing the physical servers.

Step 4: Move your database(s)

I hold the databases to last because they're the most work, and the rest of the migration can take place without them — if you choose, you can continue to run the database outside of the VPC. The pain largely depends on the size of your database and whether or not you can afford downtime.

If you can take your systems down while you back up and restore a database snapshot, then that's by far the preferable solution. It may be possible to do this for some of your databases but not all; take advantage of it where you can. The thing to remember is that once you flip the switch there's no going back without data loss.

The alternative — the only alternative if you can't afford downtime — is to create a read replica inside the VPC and promote it when you're ready. There's still some downtime with this approach, but it's measured in minutes rather than hours.

Unfortunately, as of this writing RDS does not support creating an in-VPC read replica for an out-of-VPC master database. So you have to do it the old-fashioned way, using the tools provided by your DBMS.

For MySQL I followed the process here: you create an RDS read replica that you then clone to create the in-VPC replica. It's a fairly complex process, and you'll probably have to redo it a couple of times due to mistakes. In the hope of minimizing those mistakes, here are a few of the things that I learned the hard way:

  • Give yourself plenty of time when you set the backup retention period. This will allow you to temporarily shut down replication to do things like optimize tables and indexes in the new database. And if you've been running your applications for since EC2-Classic days, this is probably very necessary.
  • Remember to create a security group on your out-of-VPC database that allows access from inside the VPC. This is easier if you put the in-VPC database on a private subnet that has a NAT. For various reasons I needed to leave our large database publicly accessible.
  • Rebooting your replica will change its IP address. Not an issue if you're connecting via NAT, but a huge issue if you've configured the replica as publicly accessible. If you plan to reboot (for example, to change replica configuration) turn off replication first, and make sure that you have the new replica IP in your security group before turning it back on.
  • The instructions tell you to save the value of Read_Master_Log_Pos from the initial slave. What it doesn't say is that Exec_Master_Log_Pos must have the same value. If they don't, you'll end up with a replication failure because the slave relay log contains transactions that haven't completed. I found that you could enable and disable replication during a time of low database activity to bring these two values into sync.

One last thing about migrating a database: when you restore an RDS database from snapshot it needs to “warm up”: the blocks from the snapshot are actually stored on S3 and will be read on an as-needed basis. This is a general issue with EBS volumes based on snapshots, and AWS provides instructions for doing this with EC2. Unfortunately, you can't do the same thing with RDS. I've experimented with different approaches to warming up an RDS instance; depending on the size of your database you might find one of them useful. You could also use the in-VPC read replica to run production queries, as long as you're OK with possible replication lag.

Step 5: Profit!

OK, profit is never guaranteed, but at least you'll be out of EC2-Classic. And hopefully the process of moving has pushed you toward improving your automated deployments, as well as giving you a chance to clean up some of the cruftier parts of your systems.

Tuesday, March 13, 2018

Simplifying AWS Application Deployment with CloudFormation

Application deployment is hard. Well, maybe not so hard when you only have one or two applications, because you can manually provision a server and copy the deployment package onto it. And maybe not when you're at the scale of Google, because you had to solve the hard problems to get there. But at the scale of a dozen or so applications, deployed onto a couple of dozen EC2 instances (ie, a typical micro-service architecture), you might end up in a state where you're spending far too much time deploying, and far too little time developing.

There are many tools that try to solve the problem from different angles: Chef and Puppet for configuring machines, Terraform to bring those (virtual) machines into existence. Ansible to do both. And Docker, which holds the promise that your deployment package can contain everything needed to run the application (but which, in my experience, drastically limits your ability to look inside that application while it's running).

This post examines my experience using CloudFormation and CFNDSL to manage the deployment of several dozen Java applications and supporting infrastructure onto a hundred or so EC2 instances. Each section is a lesson learned.

Generate Your Templates

I think the first thing that everyone realizes about CloudFormation is that its templates are unmaintainable. A simple application deployment with auto-scaling group, alarms, and elastic load balancer needs over 300 lines of pretty-printed JSON. It's not (just) that JSON is verbose: a YAML version is still north of 100 lines. The real problem is that a CloudFormation template has to be explicit about every component that goes into the deployment, from EC2 instance type to how long the load balancer should wait before verifying that an instance is healthy.

For a single application this isn't too bad: once you understand what goes into the various resources, you can make changes fairly easily. But that ability diminishes rapidly once you start adding deployments to the file, even if you're careful about naming and ordering. If you want to, for example, change the maximum number of instances for an application it's not enough to search for MaxSize: you also need to verify that you're in the right resource definition.

The solution is to write a program to generate the templates, leveraging the DRY (Don't Repeat Yourself) principle. Write one function to generate an auto-scaling group (or whatever) and call that for all of your deployments. I prefer an interactive language such as Ruby for developing such programs because of its quick turnaround time, and was happy to be introduced to CFNDSL, but you can find tools in almost any language.

Hide Complexity

CloudFormation templates are hundreds of lines long because they have to specify every detail about a deployment. However, as I learned, real-world deployments depend on only a few parameters; most of the configuration can be defaulted. Here are the items that I used to configure my deployments:

  • A name, to differentiate deployments. This is used to generate CloudFormation logical IDs and export names, so must use a limited character set.
  • A “friendly” name, which is stored in Name tags for all of the resources created by the stack.
  • A pointer to the application's deployment bundle. We used Maven, so this was a group-artifact-version specification.
  • For auto-scaled deployments, the minimum and maximum number of instances and scaling configuration.
  • For deployments that included an Elastic Load Balancer, the ports that were to be exposed, the protocol they would listen to, and the destination port (we used ELB-Classic almost exclusively; one deployment used an Application Load Balancer, which requires more configuration).
  • Any “notification” alarms: for us these were based on passing a maximum CPU level, missing heartbeats on CloudWatch, or excessive messages sitting in a queue. For each of those, the actual configuration amounted to two or three pieces of data (eg: queue name and age of oldest message).

The simplicity of this configuration, however, means that there is complexity behind the scenes. The program that generated application templates was around 800 lines of Ruby code and DSL directives (although to be fair, some of that was because it had to support multiple deployment types — a violation of the next rule). But it's still much easier to add features: when I needed to add an alarm based on the oldest messag in queue, the code itself was maybe a half hour, followed by another half hour of testing, followed by an hour or so to update all of our deployments (most of which could have been parallelized).

Maintain Consistency

Manual deployments tend to be unique snowflakes, with different software packages, different directories for deployment and configuration, and perhaps different logins. This is fine as long as everybody on your team knows the details of every deployment. But that knowledge quickly breaks down as the number of deployments increase. And sooner or later you'll be the person trying to diagnose a problem in a server deployed by someone else, and have no idea where to even start.

There's a strong temptation, when you're generating templates programmatically, to support different deployment types. This temptation is especially strong if you're trying to support existing deployments. Resist this temptation, as it just makes your template generator more complex.

There are many practices to help maintain consistency. Two that I try to follow are the Twelve-Factor methodolocy, particularly regarding configuration, and the Linux filesystem hierarchy. It really is half the battle to know that you'll always find an application's configuration in `/etc/opt/mycompany` and its logs at `/var/log/mycompany`.

Use a Pre-Built AMI

One of the best tools that I know of to maintain consistency is to pre-build your AMIs with all of the tools and support software that you need. This is also one of the best ways to improve your startup times, versus running Chef or similar tools once the AMI starts.

That isn't to say that you can't or shouldn't use tools to create the AMI in the first place. You should definitely do that, with your build scripts checked into source control. This is especially important because you'll need to re-create those AMIs on a regular basis in order to get the latest patches.

Provide Debugging Tools

I've occasionally said that I can track down any Java bug with a thread dump and a heap dump. That's not true, but the converse is: without being able to see what's happening inside a running JVM, you have almost no chance of figuring out problems (especially if your logging isn't that great). But, amazingly, the default Java installation for AWS Linux is the JRE, not the JDK, so you don't have debugging tools available.

If you build your own AMI, this is your opportunity to include whatever tools you think you might need when production goes down late at night. Don't skimp.

Sunday, February 18, 2018

Cleaning up AWS ElasticSearch indexes with Lambda

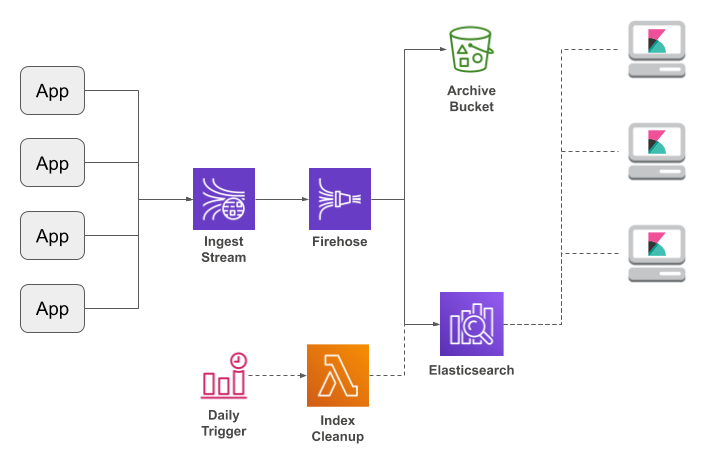
The Amazon ElasticSearch Service is a great solution for in-house logging: it's an easily-configurable search engine with built-in Kibana service to explore your log messages. If you use my Log4J AWS appenders to route application logging into a Kinesis Data Stream and thence through Kinesis Firehose to ElasticSearch, you can have a complete logging framework up and running within a few hours.

But there's one problem: there's no automated purge of old messages. True, you can use Curator, which is the standard management tool for ElasticSearch, but you need to run it from somewhere. Which means your personal PC, or bringing up an EC2 instance just for system management, and both of which are a step away from the "managed for you" promise of AWS.

This post presents an alternative: invoking the ElasticSearch Indices API via a AWS Lambda function that's triggered by a CloudWatch Scheduled Event.

The Lambda Function

Warning: this code is destructive. While I do not believe that it contains any bugs, I do not make a warranty of any kind, and do not not accept any responsibility for your deployment. I strongly recommend that you fully understand and test it before using in a production environment. Use at your own risk.

OK, with that out of the way, the Lambda function is quite simple: it reads the list of indexes from the ElasticSearch cluster, discards those with names that don't match a configured prefix, sorts the rest (relying on the datestamp that Firehose appends to each index), and deletes all but the desired number. Both retrieve and delete are HTTP requests, which is why you do not want to expose your cluster to the open Internet.

Most of the people that I've talked with protect their ElasticSearch cluster with an IP-address-based access policy. Unfortunately, such a policy blocks Lambda, which receives a new IP for every instantiation. You can work around that restriction with signed requests, but that makes the deployment significantly more complex.

I've provided one version of the code that uses signed requests and one that doesn't; pick the one that's most relevant to your environment.

Version 1: unsigned requests

If you have a VPC with a NAT, and your ElasticSearch cluster allows unrestricted requests from the NAT, then this is the version for you. It would also work if your ElasticSearch cluster was running inside the VPC, but as of the time of this writing Firehose can't talk to an in-VPC ElasticSearch cluster, so that case is irrelevant (at least for a Firehose-based logging pipeline).

Under these conditions, we can use the HTTP connection code that's built-in to the Python runtime. And because of that, we can enter the script directly into the AWS Console.

import http.client
import json
import os

def lambda_handler(event, context):
    endpoint = os.environ['ELASTIC_SEARCH_ENDPOINT']
    numIndexesToKeep = int(os.environ['NUM_INDEXES_TO_KEEP'])
    indexPrefix = os.environ['INDEX_PREFIX']
    
    cxt = http.client.HTTPConnection(endpoint);
    
    cxt.request('GET', '/*')
    indexResponse = cxt.getresponse()
    indexResponseBody = indexResponse.read().decode("utf-8")
    if (indexResponse.status != 200):
        raise Exception('failed to retrieve indexes: ' + indexResponseBody)

    indexData = json.loads(indexResponseBody)
    indexNames = sorted([x for x in indexData.keys() if x.startswith(indexPrefix)])
    indexesToDelete = indexNames[0 : max(0, len(indexNames) - numIndexesToKeep)]

    for idx in indexesToDelete:
        cxt.request('DELETE', "/" + idx)
        deleteResponse = cxt.getresponse()
        deleteResponseBody = deleteResponse.read().decode("utf-8")
        if deleteResponse.status == 200:
            print("deleted " + idx)
        else:
            raise Exception("failed to delete " + idx + ": " + deleteResponseBody)

I'm going to assume that you're comfortable creating a Lambda function (if not, go through the tutorial). Here are the key points for setting up your function:

  • Pick the "Python 3.6" runtime.
  • Configure the environment variables described below.
  • You can leave the default memory allotment, but increase the runtime to 30 seconds (HTTP calls may take a long time).
  • You will need a role that has the AWS-provided "AWSLambdaVPCAccessExecutionRole" policy. I recommend creating a new role just for the cleanup Lambdas.
  • Ensure that the Lambda is configured to run inside the VPC, on a private subnet that routes outbound requests through the NAT.

Version 2: signed requests

If your ElasticSearch cluster limits access by IP and does not permit access from a NAT, you'll need to use this version. It makes arbitrary signed HTTP requests, a feature that is not currently supported by the AWS Python SDK (Boto3). So instead, I use the aws-requests-auth and requests libraries, which means that we have to create a deployment package rather than simply pasting the source code into the AWS Console. And we have to ensure that the Lambda function has permission to update the ElasticSearch cluster. As I said, significantly more complex.

To start, you'll need to create a directory and install dependencies (I'm assuming that you're working on Linux and have Python 3.6 and PIP already installed).

mkdir escleanup

cd escleanup

pip install aws-requests-auth -t `pwd`
Next, the code. Save this in the file lambda_function.py:
import json
import os
import requests

from aws_requests_auth.aws_auth import AWSRequestsAuth

def lambda_handler(event, context):
    endpoint = os.environ['ELASTIC_SEARCH_ENDPOINT']
    numIndexesToKeep = int(os.environ['NUM_INDEXES_TO_KEEP'])
    indexPrefix = os.environ['INDEX_PREFIX']
    
    auth = AWSRequestsAuth(aws_access_key=os.environ['AWS_ACCESS_KEY_ID'],
                           aws_secret_access_key=os.environ['AWS_SECRET_ACCESS_KEY'],
                           aws_token=os.environ['AWS_SESSION_TOKEN'],
                           aws_region=os.environ['AWS_REGION'],
                           aws_service='es',
                           aws_host=endpoint)

    indexResponse = requests.get('https://' + endpoint + '/*', auth=auth)
    if (indexResponse.status_code != 200):
        raise Exception('failed to retrieve indexes: ' + indexResponse.text)
        
    indexData = indexResponse.json()
    indexNames = sorted([x for x in indexData.keys() if x.startswith(indexPrefix)])
    indexesToDelete = indexNames[0 : max(0, len(indexNames) - numIndexesToKeep)]
    
    for idx in indexesToDelete:
        deleteResponse = requests.delete('https://' + endpoint + '/' + idx, auth=auth)
        if deleteResponse.status_code == 200:
            print("deleted " + idx)
        else:
            raise Exception("failed to delete " + idx + ": " + deleteResponse.text)

This has to be turned into a ZIP file, along with all of its dependencies:

zip -r /tmp/escleanup.zip .

Now you can create your Lambda function. As with above, we use the "Python 3.6" environment, and start with the default Lambda execution role. In the second page of the creation wizard you will upload the zipfile and set environment variables as below (you can also decided to run in a public subnet of your VPC, but it's fine to leave the Lambda outside your VPC).

The big change with this version is that you should create a new role rather that reuse an existing one, because we're going to grant permissions to that role in the ElasticSearch cluster. If you've configured your cluster to allow IP-based access, then it probably has an access policy that looks like this (only with more IPs):

{
  "Version": "2012-10-17",
  "Statement": [
    {
      "Effect": "Allow",
      "Principal": {
        "AWS": "*"
      },
      "Action": "es:*",
      "Resource": "arn:aws:es:us-east-1:123456789012:domain/example/*",
      "Condition": {
        "IpAddress": {
          "aws:SourceIp": [
            "54.85.66.156",
            "52.3.98.34"
          ]
        }
      }
    }
  ]
}

You will need to add a statement that allows access from the role (replacing the ARNs shown here with those for your role and ElasticSearch domain):

{
  "Version": "2012-10-17",
  "Statement": [
    {
      "Effect": "Allow",
      "Principal": {
        "AWS": "arn:aws:iam::123456789012:role/ESCleanup"
      },
      "Action": "es:*",
      "Resource": "arn:aws:es:us-east-1:123456789012:domain/example/*"
    },
    {
      "Effect": "Allow",
      "Principal": {
        "AWS": "*"
      },
      "Action": "es:*",
      "Resource": "arn:aws:es:us-east-1:123456789012:domain/example/*",
      "Condition": {
        "IpAddress": {
          "aws:SourceIp": [
            "54.85.66.156",
            "52.3.98.34"
          ]
        }
      }
    }
  ]
}

Configuration

Like all good Lambda functions, these are configured via environment variables (note: the signed version also uses variables provided by Lambda itself):

  • ELASTIC_SEARCH_ENDPOINT is the endpoint of your cluster, copied from the “Overview” tab on the AWS console.
  • NUM_INDEXES_TO_KEEP is the number of indexes that you want to keep. This is easier than date arithmetic: rather than “keep the last month,” you keep the last 31 days.
  • INDEX_PREFIX identifies the indexes that should be considered for deletion: an ElasticSearch cluster may be used for multiple purposes, and you don't want to destroy another project's data (or the internal .kibana index). Assuming you're populating your ElasticSearch cluster via Kinesis Firehose, use the IndexName from the firehose destination configuration.

Cloudwatch Event Trigger

So you've got the function, but how do you invoke it? This is where CloudWatch Events comes in: in addition to tracking changes to your AWS environment, it can generate scheduled events, which can be used as a trigger for our Lambda.

Use the AWS Console to create a new rule and assign it to your Lambda on a single page. I recommend using a cron expression rather than a fixed rate, so that you can ensure that the cleanup happens when there's not much logging; here's an example that runs at 1 AM EST:

0 6 * * ? *

Testing

As I said earlier, you should test this code before moving to production. If you already have a test cluster that you don't mind playing with, that's the best solution. Alternatively, you could create a copy of your production cluster, although this may be impractical if you have a multi-terabyte cluster (and the instructions take a few tries to get right — I got very good at migrating clusters while writing this post).

Another alternative is to create a small test cluster (a single t2.small.elasticsearch instance, which costs under 4 cents an hour) and manually create empty indexes using curl:

curl -XPUT 'https://search-example-redacted.us-east-1.es.amazonaws.com/example-18-02-18'

As long as the indexes that you create can be sorted and follow a standard naming scheme, the Lambda function will do its thing. You can also adjust the parameters of the CloudWatch Event to perform more frequent deletions, and watch the function execute.

Licensing

Normally I don't mention licensing for code snippets, but I'm planning to use this in my day job and my employment contract requires an explicit license for any not-for-hire code that I use. So, it's licensed under the Apache License 2.0. That said, I really don't want to put a dozen lines of license boilerplate on a 30-line program, and the license says that it can be "attached to" the work. If you use the code, please copy the following boilerplate:

Copyright 2018 Keith D Gregory

Licensed under the Apache License, Version 2.0 (the "License");
you may not use this file except in compliance with the License.
You may obtain a copy of the License at

    http://www.apache.org/licenses/LICENSE-2.0

Unless required by applicable law or agreed to in writing, software
distributed under the License is distributed on an "AS IS" BASIS,
WITHOUT WARRANTIES OR CONDITIONS OF ANY KIND, either express or implied.
See the License for the specific language governing permissions and
limitations under the License.

Source and documentation is available at http://blog.kdgregory.com/2018/02/cleaning-up-aws-elasticsearch-indexes.html

Contains example code from https://github.com/DavidMuller/aws-requests-auth