Showing posts with label debugging. Show all posts

Tuesday, May 28, 2024

My Tests Are Good At Finding AWS Bugs

I recently made a minor change to my logging library. And, minor though it was, I run a full suite of integration tests before any release. I wasn't expecting any problems, so was surprised when the first test against Kinesis failed. More puzzling: the primary assertions in the test all passed; the records were properly written to the stream. What failed was an assertion that there weren't any internally-logged errors.

Digging in, I discovered that the failure was a ResourceNotFoundException: Kinesis was claiming that the stream didn't exist! This particular test created the stream, waited for it to become active, and then immediately tried to write a batch of messages to it. I looked through the code to see if there was any way that it could be writing the batch before the stream was active, and didn't see one. I then put debugging messages into the code to be sure. The stream was definitely active when the batch was written.

I then extracted the code into a stand-alone program,** and discovered that PutRecords claimed that a newly-created stream didn't exist, even after a dozen or more calls to DescribeStreamSummary said that yes, it did. And a second call to PutRecords, invoked immediately afterward, succeeded. It seems that their internal name->ARN lookup service has a race condition.

Since my company has business-tier support with AWS, I submitted a ticket that included the demo program. And 24 hours later received a message asking for additional information, including “a detailed system architecture.” I'm tempted to rant about AWS support, but I'm sure they're overwhelmed. At least they don't use Q to handle first-tier response — yet. I also pinged a friend who works for AWS, but haven't heard back via that channel either.

I also did some digging and discovered that I could work around the problem by (1) passing the stream ARN to PutRecords instead of the name, or (2) inserting a one-second sleep between receiving the “active” status and trying to send the batch.

As far as the log-writer itself is concerned, the error isn't a problem: it retries the send. That's why the primary assertions succeed: all of the messages are in fact written. So my decision is whether to wait for AWS to fix the problem or change my tests to work-around it. Or change the library to use ARN, on the assumption that that's the “preferred” argument for the PutRecords call.


* In case you're wondering about the title, you can read about my last experience here.

** A Python program that displays the behavior is here.

Thursday, July 13, 2023

Buggy Behavior From The CloudWatch Logs API

Tip 26: “select” isn't broken.
The OS is probably not broken. And the database is probably just fine.

The Pragmatic Programmer

Words to live by — although I did once find a problem with Oracle's index management, which manifested in select. In my opinion, it's the maxim that defines a senior developer. Junior developers always look outside themselves whenever they run into a problem. Senior developers do everything they can to find where they've made a mistake. After all, there are a lot of people doing exactly the same things that you are; surely they would have found the bug first.

But sometimes, it really is a bug in the system. This post is a story of how I determined the bug wasn't in my code. It's part catharsis, part “here's what you should do if you think select is broken,” and part calling out the issue for posterity in case someone else trips over it.

In January of this year (2023), AWS made a change in the CloudWatch Logs API: you no longer needed to provide a sequence token when calling PutLogEvents. Sequence tokens were always, I think, a “leaky abstraction”: a part of the internal implementation of CloudWatch Logs that found its way into the API. To summarize: you had to retrieve a sequence token before you could write events. When you wrote a batch of events, you received a sequence token back, which you could use to write the next batch — unless another process was writing to the same stream, in which case your sequence token would become invalid. Which meant that you had to retrieve a new token, using an API that had a relatively low limit on number of requests per second. With enough concurrent writers, hilarity would ensue as each would retrieve a token, try to use it, and fail because some other writer got there first.

This change directly impacted my logging library, but initially I wasn't planning to adopt it: the library worked, the old behavior was supported, and to be honest, releasing the library involves a lot of toil. But then someone found a bug with my sequence-token retrieval code if the logging library happened to re-initialize itself (Log4J2 FTW!). I fixed the immediate bug, and released a patch, but then decided it was a sign from the universe that I should remove the sequence token entirely. Plus, it always feels good to delete code!

However, once I changed the code, one of my integration tests — the one that pits concurrent writers against each other — started failing. When it tried to verify the events that were written, it would often come up short.

Failing integration tests are nothing new to this library: CloudWatch is an “eventually consistent” system, and while “eventually” often means seconds, it sometimes takes longer for the service to become consistent. As a result, failing tests don't clean up after themselves, so that I can look at what happened. I could then use my log reader utility, and verify that all of the events were eventually available.

This time, I didn't get all of the events back. Of course, I assumed that my reader was incorrect, and dove back into the documentation for the API calls it was using. I experimented with different arguments to the GetLogEvents call, and also tried FilterLogEvents. But nothing I did had an effect: I was still missing log entries.

Next step was to dig into the logging library. I already had it fairly well instrumented: if you enable debug mode in the logging framework it will report everything that it does, including (optionally) every batch that it sends. Everything looked good, but there was a corner case that worried me: CloudWatch can reject events, and unlike Kinesis, it doesn't tell you which events it rejects. The appender pre-processed batches to remove invalid events, but didn't log failures (because there shouldn't be any). I changed that code, but no failures appeared.

At this point I didn't think the bug was in my appender, but there was always the possibility that I was doing something incorrectly that I didn't log. My next step for debugging the appender would have been to turn up the logging level within the AWS SDK, to get a detailed report of what it was doing. However, this can become a case of drowning in detail, so first I looked at alternative methods of verifying the events.

In addition to the GetLogEvents and FilterLogEvents API calls, CloudWatch provides a query API. This API requires you to submit a query and then loop until it's done, so I didn't have a utility program that used it. But it's what the Console uses in the Insights page.

So I wrote a simple query to retrieve events from the stream; I was actually more interested in the reported count, rather than looking at all 20,000 expected events. But Insights told me that there weren't any events in the stream.

At this point, I opened a ticket with AWS Support (fortunately, I have access to an account with a Business support contract, since “Basic” support no longer allows technical questions). I received an answer that “as designed,” Insights does not return any messages with timestamps prior to the log group's creation time. WTF?!?

The back-story is that my Log4J 1.x appender lazily creates the log group and stream when it first writes a batch of messages, because Log4J 1.x does not have an explicit initialization phase. This is definitely something to be aware of if you use my library with Log4J 1.x (and, overwhelmingly, that's what my download counts indicate people are doing). The solution is to pre-create your log groups, so I modified the test to do so. This is not an issue with Log4J 2.x and Logback, which do have an initialization phase.

But the test continued to fail. However, I could view the logs in Insights, and saw that it was able to retrieve all of the events (yet another approach, which also succeeded, is export to S3). And more interesting, it was the initial few log messages that weren't being retrieved by GetLogEvents. I also called the DescribeLogStreams API, and it returned a later “first event timestamp” than expected, by a few milliseconds.

This seemed worth another Support ticket: if I could retrieve all log events using one technique, and not using another, then clearly it was a problem with CloudWatch and not me.

And now comes the most important lesson from this entire adventure: do not assume that the AWS Support rep can see what you're describing, and more important, do not expect them to tell you that they can't.

I had created a log group/stream that demonstrated the problem, referenced it in the ticket. I also attached the S3 export, the list of events from my log reader, and the initial events from an Insights query. The support rep seemed to agree that there was a problem. Then for a week they wrote nightly updates about how they were trying to re-upload the events and did not see a problem. They seemed to be trying random things, so I recommended building my library and running the integration test — at this point, my assumption was that AWS accepted that there was a problem based on my example group/stream, and were simply trying to re-create at will.

It turned out this was an incorrect assumption, which I learned when the original rep went dark and a new rep picked up the case. I had independently created a program that triggered the issue, so that they wouldn't have to run the integration tests. The new rep claimed to have run the program, did not see the issue, and pointed out that AWS did not have permission to view the original log group and stream that I had identified in the ticket!

Seeing that the “web” interactions were not having any effect, I decided to try a chat session with a screenshare. I showed the rep the original group and stream, and how different retrieval methods returned different results. At the time it didn't seem to have much effect: he made sounds of acknowledgement, but was unable to assume the role I created to let him read events, and would go silent for minutes at a time while he was “try[ing] something.” All-in-all, not a great experience from my side.

But it did seem to have an effect: the next morning I got a message from someone who claimed to be on the CloudWatch team, saying that they were able to re-create the problem. And that's where it stands today. For my part, the updates to my library are on hold until I hear back: while this may be superstition on my part, it seems to work better if I provide a sequence token (I suspect it's actually the delay from retrieving the token).

And if you run into a problem with GetLogEvents not returning all of your events, feel free to reference case #12882575541 if you file a Support ticket.

Update, 2023-08-22

AWS has resolved the problem: "We investigated and found that there was an issue with the service which in rare situations can incorrectly set the "firstEventTimestamp" on a log-stream [...] Our team has now fixed the issue with GetLogEvents not returning some events due to incorrectly set "firstEventTimestamp"." Have verified that my integration tests run (repeatedly) without a failure. It took just under three months (05/23 to 08/18) to resolve the case, two months (06/15) from the point that someone took it seriously. For a company the size of AWS, and a service with the reach of CloudWatch Logs, that seems pretty fast; I've had issue drag on far longer with in-house IT teams.

Saturday, May 7, 2022

A Self-Made Bug

Chasing a bug can be one of the most frustrating parts of software development. All you have to start with is an observed behavior. Hopefully you can replicate that behavior. You then have to gather the information needed to understand what caused the bug, which is mostly about ruling out what didn't cause it. With luck, you have the tools (logging, system utilities) that let you do this.

And then, when you figure out what it is and fix it, most of the time your thought is “wow, that was dumb.” It's definitely not the same feeling you get when you finish a challenging feature.

This is the story of me tracking down a bug. I'm writing it as a form of catharsis, but also because I think it illustrates the lengths a developer has to go to to prove that something is a bug. In this case, it wasn't, really, just me doing something dumb and not realizing it.

The story starts with me implementing what I thought would be a simple web service to let a client upload large files to S3. Simple, because I started with an example that I'd written for a blog post. After a couple of hours to convert something intended as a teaching tool into something user-friendly and easy to deploy, and I was ready to test. Some small files went through with no problem, so I selected a 12.5 GB file and went for a bicycle ride.

When I got back, there was no browser running.

The first rule of debugging is that you need to reproduce the bug, so I started the upload again and switched my focus to another task. An hour or so later, I went back to the VM running my test, and again, no browser running.

I started the upload again, and paid careful attention to the requests flowing through the Network tab in the Firefox developer tools. Everything looked good, so I turned to top: when programs die unexpectedly, it's often due to memory errors. Sure enough, I saw that the resident set size (RSS) kept growing.

OK, probably a bug in my code. I'm not much of a JavaScript developer, and don't really understand how it manages memory, so I'm probably holding onto something unintentionally. Fortunately, the code is simple, and I was able to set a breakpoint in a "progress monitor" callback. After digging through various object trees accessible from my code, I was convinced that nothing I did caused the problem.

Time to turn to Google (and Duck Duck Go, which I'm trying as an alternative), to see if maybe there's something wrong with the AWS JavaScript library. I didn't expect to find anything: the second rule of debugging is that when you think there's a problem with a commonly-used library, it's you. But I was using an older version of the library, and perhaps uploading 12 GB from the browser was unusual enough to hit a corner case. Unfortunately, most of the search hits were from Stack Overflow, and were basic “how do I use this library?” questions.

One of the great things about having browsers built by different companies is that you can do comparison tests. I fired up Chrome, started the upload, and watched top; no change in its RSS, and the overall available memory remained constant. I started a Windows VM and did the same thing with Edge, and while the Windows Task Manager doesn't give the level of information that top does, it also appeared to handle the upload without a problem.

More Googling, now on Firefox memory issues. And from that, I learned about about:memory, which lets you see the memory usage of every Firefox process. With that page open in one window, I started my upload from another. After a gigabyte or so of the upload, I checked the memory dump … and it didn't show any excess memory consumption. Neither did top. WTF?!?

At this point it hit me: every time the browser crashed, I had Developer Tools open. So the browser was holding onto every chunk of the file that it uploaded, in case I wanted to go to the Network tab to inspect those requests.

Is there a lesson here? Not really; it's just an example of following the process I first wrote about a dozen years ago. But as I said, it's catharsis, and a reminder that most problems are PEBKAC: Problem Exists Between Keyboard And Chair.

Monday, March 30, 2020

S3 Troubleshooting: when 403 is really 404

It's generally a bad idea to click on links in strange websites, but this one is key to this post. If you were to click this link, you'd see a response like the following, and more importantly, the HTTP response code would be a 403 (Forbidden).

<Error>
  <Code>AccessDenied</Code>
  <Message>Access Denied</Message>
  <RequestId>CC60CD5C69BC271F</RequestId>
  <HostId>gBmQHQNr/7CFHLCbiYjqzm3iT2m5WQCobTfxFiXIj9K0448YrtvJKbOimEXHwAxwILw0oDcS9TI=</HostId>
</Error>

However, that bucket is open to the world: AWS reminds me of this by flagging it as “Public” in bucket listings, and putting a little orange icon on the “Permissions” tab when I look at its properties. And if you click this similar link you'll get a perfectly normal test file.

The difference between the two links, of course, is that the former file doesn't exist in my bucket. But why isn't S3 giving me a 404 (Not Found) error? When I look at the list of S3 error responses I see that there's a NoSuchKey response — indeed, it's the example at the head of that page.

As it turns out, the reason for the 403 is called out in the S3 GetObject API documentation:

  • If you have the s3:ListBucket permission on the bucket, Amazon S3 will return an HTTP status code 404 ("no such key") error.
  • If you don’t have the s3:ListBucket permission, Amazon S3 will return an HTTP status code 403 ("access denied") error.

While my bucket allows public read access to its objects via an access policy, that policy follows the principle of least privilege and only grants s3:GetObject. As do almost all of the IAM policies that I write for things like Lambdas.

Which brings me to the reason for writing this post: Friday afternoon I was puzzling over an error with one of my Lambdas: I was creating dummy files to load-test an S3-triggered Lambda, and it was consistently failing with a 403 error. The files were in the source bucket, and the Lambda had s3:GetObject permission.

I had to literally sleep on the error before realizing what happened. I was generating filenames using the Linux date command, which would produce output like 2020-03-27T15:43:31-04:00. However, S3 notifications url-encode the object key, so the key in my events looked like this: 2020-03-27T15%3A43%3A31-04%3A00-c. Which, when passed back to S3, didn't refer to any object in the bucket. But because my Lambda didn't have s3:ListObjects I was getting the 403 rather than a 404.

So, to summarize the lessons from my experience:

  1. Always url-decode the keys in an S3 notification event. How you do this depends on your language; for Python use the unquote_plus() function from the urllib.parse module.
  2. If you see a 403 error, check your permissions first, but also look to see if the file you're trying to retrieve actually exists.

You'll note that I didn't say “grant s3:ListObjects in your IAM policies.” The principle of least privilege still applies.

Saturday, August 4, 2018

The KFEK Stack: A Logging Pipeline for AWS

This post is a short introduction to building a logging pipeline based on managed services provided by AWS. I've covered this topic in a presentation for the Philadelphia Java User's Group, and in a much longer article on my website. I've also built such a pipeline, aggregating log messages from (when I left the company) a 200 machine production environment that generated 30 GB of log messages per day.

I'll start with a quick review of why log aggregation is a Good Thing, especially in a cloud deployment:

  • You may have many machines writing logs.

    To inspect those logs you either need to go to the machines themselves, pull the logs to your workstation, or push them to a centralized location. And your system operations group may have very strong feelings about some of these options.

  • You may have many machines running the same application.

    To track down a problem, you will have to examine multiple logfiles, and be able to identify which machine they came from.

  • You may need to correlate log messages from different applications.

    This is a particular problem in a micro-service architecture: your web requests may fail due to a remote service, meaning that you have to correlate logs from different machines.

  • Machines regularly shut down.

    The promise of cloud deployments is that you can scale-up and scale-down in response to actual load. However, scaling down means terminating the instance, and that means losing all files that haven't been retrieved or pushed to a central location.

There are many ways to approach centralized logging. One of the simplest — and for a small deployment, arguably best — is to ship your logs off to a third-party provider, such as Loggly or SumoLogic. They make it easy to start with centralized logging, providing useful tools at a very reasonable price. The downside is that, as your logging volumes increase, you may move into their “call us” pricing plans.

The standard self-managed solution is the “ELK” stack: Elasticsearch, Logstash, and Kibana. All are products of elastic, which provides these three products in open source versions and makes their money from paid enhancments and consulting.

In my eyes, there are two primary drawbacks to deploying the ELK stack. The main one is that you have to deploy it — and possibly wake up in the middle of the night when one of the nodes in your Elasticsearch cluster goes down. This drawback is answered by Amazon Elasticsearch Service, a managed implementation of Elasticsearch and Kibana. It allows you to bring up or reconfigure an Elasticsearch cluster with a few mouse clicks in the console, and the AWS ops team will fix any failed hardware for you. In exchange, you pay slightly more than a self-hosted solution, and give up some flexibility. For me that's a good deal.

The second drawback to the ELK stack is the “L”: Logstash, and its companion, Filebeat. To make the ELK stack work, you need to install an agent on each machine: that agent looks at local logfiles, parses them, and ships a JSON representation off to Elasticsearch. This isn't too onerous, as long as you format your logfiles to match one of the out-of-the-box formats, but if you don't you need to write regexes. And you need to manage the on-host logfiles, using a tool like logrotate.

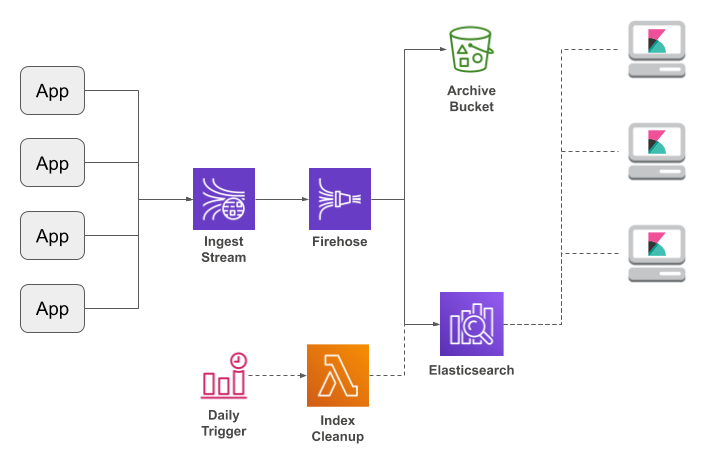
My solution is to have applications write JSON-formatted messages to a Kinesis Data Stream, where they are picked up and sent to Elasticsearch via Kinesis Firehose.

The chief benefit of this architecture — aside from not installing log agents or being woken up in the middle of the night — is scalability. A Kinesis Stream is built from shards, and each shard can accept 1,000 messages or 1 MB per second. As your logging volume increases, you can add shards as needed. Firehose will accommodate the increased throughput by writing to Elasticsearch more frequently. And if you start pushing the limits of your Elasticsearch cluster, you can expand it from the AWS Console.

There is one question remaining: how do the applications write directly to the Kinesis stream? It's actually a rather challenging problem, as writers need to use bulk APIs for performance, but be prepared to resend individual messages. My solution, since I come from a background of Java and Log4J, was to write a Log4J appender library (which also supports other AWS destinations). But I'm not the only person who has had this idea; Googling turned up implementations for Python, .Net, and other languages (I haven't tried them, so am not linking to them).

To recap: if you have a few dozen machines, you'll probably find third-party log aggregators a cost-effective, easy solution. But if your logging volumes are high enough to warrant the cost, this pipeline is an effective alternative to a self-managed ELK stack.

Wednesday, March 21, 2012

Static Variables Considered Harmful

In my last post, I mentioned that a particular programmer had abused static initializers. I've been thinking more about this, and decided that the real problem was that this programmer actually abused static variables. The initializer abuse was simply a side effect, an attempt to make a bad design work.

To start, I'm going to give you my thoughts on static initializers: they're a code smell in and of themselves. If you're not familiar with a static initializer, here's an example: we have a static Map used for a lookup table, and want need to populate it before use. The static initializer is run at the time the class is loaded, before any code is allowed to use the class, so we can guarantee that the map will be populated.

public class MyClassWithALookupTable
{
    private static Map<String,String> states = new HashMap<String,String>();
    
    static
    {
        states.put("AK", "Alaska");
        states.put("AL", "Alabama");
        // ...
    }

This sort of code is, in my opinion, the only valid use for a static initializer: initializing an object that will never change, using code that is guaranteed never to throw. In effect, creating a constant.

The “guaranteed never to throw” part is important: static initializers run before any code is allowed to use the class; what happens if they do throw? The language spec says that static initializers are not permitted to throw checked exceptions, but they are allowed to throw unchecked exceptions (although a smart compiler will make you hide the exception in a called method). If the initializer does throw, you'll get an ExceptionInInitializerError the first time you access the class.

How do you debug such errors? You can't use a debugger, because the class has to be loaded to do set a breakpoint. You can insert a logging statement — assuming that your logging framework is able to initialize (one of the more painful things I've ever debugged was with a homegrown addition to Log4J that had a static initializer that threw). Even if you log the exception, you have to find where it's being thrown: people who abuse static initializers tend to do it a lot, so you might have to work through a long list of classes, adding exception handlers to each, before you find the one that's broken.

OK, so static initializers are a code smell. How do I make the leap from there to “static variables considered harmful?”

Going back to the legacy application in question, the original programmer used a static initializer to populate a lookup map. But the values to populate that map came from Hibernate. And since Hibernate was accessed through a DAO loaded as a Spring bean, he had to create a way to access the application context in a static manner. So he created a new class, with a static variable to hold the app context. And he wired this class into the DispatcherServlet configuration.

It's a long list of hacks, but here's the thing: every one of them logically proceeds from the one before it. And it comes down to the lookup table whose contents are allowed to vary.

There are certainly other solutions that he could have used. For example, I replaced the static initializer with a Spring post-construct from the associated DAO. But this is only one example of how static variables (versus constants) can lead you astray. More common are concurrency bugs, or “how did that value get there?” bugs. It seems a lot smarter to simply say “don't do this,” with the caveat for experts of “don't do this (yet).”

Monday, January 9, 2012

Marking Time

How long does it take your program to do a task? It's not a question that you usually ask — at least not until that task takes “too long.” And while it seems like a simple question, there are two ways to measure program execution time, and the difference between those two measurements is important. For one thing, it can tell you whether you have any chance of making the task take less time.

The typical measurement is “wall clock” time: the time you'd get by watching a physical clock on the wall. Although in the real world, wall-clock measurements usually come from log output:

2012-01-04 17:21:51,434 [main] DEBUG IMAPReader - connecting to imap.gmail.com
2012-01-04 17:21:53,164 [main] DEBUG IMAPReader - login successful
2012-01-04 17:21:53,164 [main] DEBUG IMAPReader - retrieving mailbox list
2012-01-04 17:21:53,286 [main] DEBUG IMAPReader - selecting mailbox: INBOX
2012-01-04 17:21:53,392 [main] DEBUG IMAPReader - executing SEARCH for all messages
2012-01-04 17:21:53,525 [main] DEBUG IMAPReader - fetching message 1
2012-01-04 17:21:53,639 [main] DEBUG IMAPReader - disconnected

This program makes a connection to Google's IMAP mail service and downloads a single message. It takes slightly more than two seconds to do this, which exceeds the one second limit required to maintain the user's train of thought. You might be tempted to fire up a profiler to see where the code is spending its time, and perhaps rewrite some of it.

A better — easier, faster — option is to measure the program's CPU time.

CPU time is the time that the processor actually runs the process. And unless CPU time is a significant fraction of wall-clock time, then any attempts at performance optimization will be wasted. Java lets you measure CPU time — with some caveats — using the ThreadMXBean class from the java.lang.management package.

ThreadMXBean threadMX = ManagementFactory.getThreadMXBean();

long start = threadMX.getCurrentThreadUserTime();
// time-consuming operation here
long finish = threadMX.getCurrentThreadUserTime();

The getCurrentThreadUserTime() method returns the number of nanoseconds that have been spent executing the current thread's code; you'll have to divide by 1000000 to convert to milliseconds. It's user-mode time, so doesn't include time spent by the kernel on behalf of the thread. Since you can only optimize your own code, in my opinion that's the best measurement.

But, as I said, there's a caveat: this method only works if the JVM and OS support thread-level time measurement; if they don't, it will throw UnsupportedOperationException. As long as you're using the Sun JVM, on recent Windows or Linux systems, you shouldn't have a problem. And if you're worried, you can call ThreadMXBean.isCurrentThreadCpuTimeSupported() before getting the CPU time. Also call isThreadCpuTimeEnabled() ; even if the JVM supports thread CPU time, it might not be enabled.

Adding CPU-time logging into the program, we get the following:

2012-01-06 07:28:37,238 [main] DEBUG JakartaIMAPReader - connecting to imap.gmail.com (current cpu = 230000000 nanos)
...
2012-01-06 07:28:39,205 [main] DEBUG JakartaIMAPReader - disconnected (current cpu = 800000000 nanos)

The difference is 570000000 nanoseconds; 570 milliseconds, or about 25% of the overall runtime. Even if you could optimize this code to zero, you'd still have 1.5 seconds of wall-clock time left; the overall speedup would be minimal. While a profiler would have told me this as well, it was a lot faster for me to add a couple of lines of code and edit two logging statements, than to run the profiler and navigate through its results.

In this case, I didn't expect much CPU consumption: I'm connecting to a remote email server, and network calls always take time, during which the program is blocked inside the OS kernel, waiting for data to arrive. And even if I didn't know that network connections behave that way, simply looking at a tool like top or the Windows Task Manager would have told me that my program wasn't consuming much CPU.

A more interesting case is when one thread is taking a lot of wall-clock time but very little CPU time, and the program as a whole is CPU-bound. In this case, the other threads in the program are affecting the thread that you need to optimize. Usually, you'll find some sort of a synchronization barrier is the cause: the thread that you're tracking is waiting for data to be delivered from one or more other threads, which are taking a long time to create that data. By measuring CPU time, you know that you have to (recursively) examine those other threads.

There's one final case that I want to mention, and that's where the CPU is being consumed by the garbage collector. This happens with message-processing applications, where the incoming messages are relatively large (especially large byte[]s that go directly into the tenured generation), and/or generate a lot of temporary objects during processing. Your best tool in this situation is JConsole to see just how much time is being spent in garbage collection.

The bottom line: before thinking about optimizations, first verify whether there's anything you can optimize.

Monday, August 9, 2010

Ant, Taskdef, and running out of PermGen

Although I've switched to Maven for building Java projects (convention over configuration ftw), I still keep Ant in my toolbox. It excels at the sort of free-form non-Java projects that most people implement using shell scripts.

One reason that Ant excels at these types of projects is that you can easily implement project-specific tasks such as a database extract, and mix those tasks with the large library of built-in tasks like filter or mkdir. And the easiest way to add your tasks to a build file is with a taskdef:

    <taskdef name="example"
             classname="com.kdgregory.example.ant.ExampleTask"
             classpath="${basedir}/lib/mytasks.jar"/>

Last week I was working on a custom task that would retrieve data by US state. I invoked those with the foreach task from the ant-contrib library, so that I could build a file from all 50 states. Since I expected it to take several hours to run, I kicked it off before leaving work for the day.

The next morning, I saw that it had failed about 15 minutes in, having run out of permgen space. And the error happened when it was loading a class. At first I suspected the foreach task, or more likely, the antcall that it invoked. After all, it creates a new project, so what better place to create a new classloader? Plus, it was in the stack trace.

But as I looked through the source code for these tasks, I couldn't see any place where a new classloader was created (another reason that I like Ant is that it's source is generally easy to follow). That left the taskdef — after all, I knew that my code wasn't creating a new classloader. To test, I created a task that printed out its classloader, and used the following build file:

<project default="default" basedir="..">

    <taskdef name="example1"
             classname="com.kdgregory.example.ant.ExampleTask"
             classpath="${basedir}/classes"/>
    <taskdef name="example2"
             classname="com.kdgregory.example.ant.ExampleTask"
             classpath="${basedir}/classes"/>

    <target name="default">
        <example1 />
        <example2 />
    </target>

</project>

Sure enough, each taskdef is loaded by its own classloader. The antcall simply exacerbates the problem, because it executes the typedefs over again.

It makes sense that Ant would create a new classloader for each project, and even for each taskdef within a project (they can, after all, have unique classpaths). And as long as the classloader is referenced only from the project, it — and the classes it loads — will get collected at the same time as the project. And when I looked in the Project class, I found the member variable coreLoader.

But when I fired up my debugger, I found that that variable was explicitly set to null and never updated. The I put a breakpoint in ClasspathUtils, and saw that it was being invoked with a “reuse” flag set to false. The result: each taskdef gets its own classloader, and they're never collected.

I think there's a bug here: not only is the classloader not tied to the project object, it uses the J2EE delegation model, in which a classloader attempts to load classes from its own classpath before asking its parent for the class. However, the code makes me think that this is intentional. And I don't understand project life cycles well enough to know what would break with what I feel is the “correct” implementation.

Fortunately, there's a work-around.

As I was reading the documentation for taskdef, I saw a reference to antlibs. I remembered using antlibs several years ago, when I was building a library of a dozen or so tasks, and didn't want to copy-and-paste the taskdefs for them. And then a lightbulb lit: antlibs must be available on Ant's classpath. And that means that they don't need their own classloader.

To use an antlib, you create the file antlib.xml, and package it with the tasks themselves:

<antlib>
    <taskdef name="example1" classname="com.kdgregory.example.ant.ExampleTask"/>
    <taskdef name="example2" classname="com.kdgregory.example.ant.ExampleTask"/>
</antlib>

Then you define an “antlib” namespace in your project file, and refer to your tasks using that namespace. The namespace specifies the package where antlib.xml can be found (by convention, the top-level package of your task library).

<project default="default" 
    xmlns:ex="antlib:com.kdgregory.example.ant">

    <target name="default">
        <ex:example1 />
        <ex:example2 />
        <antcall target="example"/>
    </target>

    <target name="example">
        <ex:example1 />
        <ex:example2 />
    </target>   

</project>
It's extra effort, but the output makes the effort worthwhile:
ant-classloader-example, 528> ant -f -lib bin build2.xml 
Buildfile: /home/kgregory/tmp/ant-classloader-example/build2.xml

default:
[ex:example1] project:     org.apache.tools.ant.Project@110b053
[ex:example1] classloader: java.net.URLClassLoader@a90653
[ex:example2] project:     org.apache.tools.ant.Project@110b053
[ex:example2] classloader: java.net.URLClassLoader@a90653

example:
[ex:example1] project:     org.apache.tools.ant.Project@167d940
[ex:example1] classloader: java.net.URLClassLoader@a90653
[ex:example2] project:     org.apache.tools.ant.Project@167d940
[ex:example2] classloader: java.net.URLClassLoader@a90653

BUILD SUCCESSFUL
Total time: 0 seconds

Bottom line: if you're running out of permgen while running Ant, take a look at your use of taskdef, and see if you can replace it with an antlib. (at least one other person has run into similar problems; if you're interested in the sample code, you can find it here).

Thursday, January 21, 2010

Debugging 401: Practicum

OK, enough with the generalities, it's time for a concrete example. And yes, I realize that debugging stories are much like fishing stories — and that fishing stories aren't terribly interesting. I've tried to stay focused, but I'll understand if you fall asleep.

A week or so ago, I saw a question on Stack Overflow that let me put all of these techniques to work. In fact, it was a nearly perfect case study of the debugging process, not to mention interesting enough to take an hour out of my day.

The question seemed simple enough: the person posting it was trying to set the F2 key as a menu accelerator in a Swing application (for those not familiar with GUIs, an “accelerator” is a way to invoke a menu item using a single keystroke; for an example, Netscape's “New Window” accelerator is Ctrl-N). On the surface, this seemed like user error, and since I happened to be working on a Swing app at the time, I changed one of my menu items to use F2 so that I could respond with the “correct” code. To my surprise, it didn't work: the F2 keystrokes seemed to vanish.

Other responders had suggested that perhaps the operating system was capturing the keypress event before it got to the program, and this seemed like a reasonable hypotheses: think of Alt-Tab or Ctrl-Alt-Delete under Windows. So, applying Scientific Method, my first task was to falsify that hypothesis, and I created a SSCEP to do so.

This first program was extremely simple: a JFrame with a JLabel as its content, and an event handler that listened for keystrokes and printed them. I ran it, hit F2, and saw that the keystrokes were being reported. Time for a new hypothesis.

My second hypothesis was that the F2 keystroke was being remapped by the operating system, so that it appeared to be some other key. Since my SSCEP was printing the keycodes, and the JDK comes with source code that showed the expected keycodes, I could easily check this. Another hypothesis falsified.

Next hypothesis: the Swing menu system is ignoring F2. Seems unlikely, but I'd apparently exhausted all other answers. So I added a menu to the SSCEP, and printed its invocations. And had another hypothesis shot down: F2 invoked the menu item.

By this point I was hooked: I saw the behavior in my own program, but wasn't able to replicate it in a SSCEP. Time to step back, and think about how my SSCEP differed from my actual application. This was easy: my program's main window was a simple tabular display using a JTable; other than that, just a menu. So I replaced the JLabel in my SSCEP with a JTable, and the F2 key stopped working!

Time for some research, starting with Sun's bug database; nothing there about JTable breaking accelerators. A little more research, and I ended up at the Sun tutorial on key bindings. Oh yeah, I remember that: individual components can intercept keystrokes; it's how the text components implement copy and paste without any program code.

This seemed very promising, so I changed my SSCEP to call getInputMap() on my table, and printed the key bindings. And didn't see a binding for F2. However, I was not yet ready to abandon this hypothesis — largely because I didn't have any others waiting.

So I fired up the debugger. Since I suspected that the table was consuming the keystroke itself, I set my first breakpoint in the processKeyEvent() method. This is a short method, so stepped through it and saw that yes, the event was being consumed due to a key binding.

It took me a little more time, but I discovered that the key binding in question wasn't in the “normal” binding map, which was why I didn't see it when I first examined the bindings. I won't bore you with the details; suffice to say that this discovery came from continued application of the scientific method, along with a little background reading of code and JavaDoc. And led to an answer that the original poster seems to have ignored … oh well, at least I had fun debugging.

Tuesday, January 19, 2010

Debugging 301: Into the Code

You've tried to write a Small, Self-Contained Example program and failed. Whatever the problem is, it only manifests in your full-scale application. What now?

The Scientific Method remains your best tool, but rather than trying to fit a hypothesis to the available data, it's now time to make predictions based on your hypotheses. And, using either log messages or a debugger, watch your program execute until you find the place where your predictions become incorrect. I've written elsewhere about logging, so this post will focus on running your code in a debugger.

The power of a debugger comes from the fact that you can examine the entire state of your program and then change it at will. In some cases, you'll be able to restart methods to see how their execution changes with different starting conditions. However, this power is also a hindrance: it's easy to get overwhelmed by the amount of information available, and even more easy to make assumptions and spend hours attempting to prove them correct.

The key is to form a hypothesis, and then look only at the code and data that are affected by that hypothesis. For example: you've written code that's supposed to upload data to a server, but it doesn't. You could waste a lot of time tracing the code, but it's more efficient to come up with a few hypotheses:

  1. You're not actually running the upload code.
  2. The upload fails due to a communication problem between client and server; the data never gets to the server.
  3. The server is unable to process the file.

Hypothesis #1 is easy to falsify: put a breakpoint at the start of the upload code and run your program. If the breakpoint is hit, then that hypothesis is done. If you don't hit the breakpoint, then you need to come up with hypotheses as to why you didn't (note, however, that falsifying this hypothesis says nothing about hypotheses #2 and #3 — you could have more bugs).

Hypothesis #2 is more difficult to falsify, because there could be many reasons for the upload to appear successful. For example, library code that ignores an exception. It might make sense to step through the code, but again all of the possibilities can waste your time. Better is to use a tool that can directly disprove the hypothesis: a TCP monitor, or perhaps using the logging that's built into your your communications library.

If you get to hypothesis #3, it will soon be time to generate a whole new set of hypotheses, to cover the different cases that would cause the server to reject your file. And it's likely that the debugger will no longer be the best tool. Because now you have enough information to create test cases to validate your code, or an SSCEP to validate the server code.

Wednesday, January 13, 2010

Debugging 202: The SSCEP

When following the Scientific Method, you need a way to test your hypotheses. And this is where the Small, Self-Contained Example program comes in: it's a program that attempts to isolate the specific problem, moving it out of the larger application. If you can cause a problem to appear in a SSCEP, you can start building new hypotheses about why it occurs. If you can't cause the problem to appear, then you've falsified the hypothesis which led to its creation, and can start formulating a new hypothesis.

Often, while you're creating a SSCEP the problem will become obvious — you'll move from the realm of science back into the realm of mathematics. It's remarkable how problems simply disappear when you give yourself the opportunity to step back and think about them without distractions.

So how do you start writing a SSCEP? The traditional way is to start with your program and pare it down until the bug stops appearing. As long as you keep track of what you remove at each step, sooner or later you will remove the buggy code. Then you figure out a better way to write it. However, you may need a lot of revisions to reach that point, and such programs tend to be larger than needed.

I prefer to start from the other end: with an empty main() method (or framework-specific class) and — guided by my hypothesis — add small pieces until it breaks. Many times, the SSCEP bears little resemblance to the real program: I'm isolating a hypothesis, not building an application.

One of the nice side-effects of this approach is that the result looks a lot like a unit or integration test. In fact, particularly when writing layered code, I can create the SSCEP using JUnit. And once I have such a test, there's no reason to throw it away. Instead, it goes into the test suite as a regression test.

Monday, January 11, 2010

Debugging 201: Scientific Method

I've never liked the term “computer science.” Science, and the scientific method, is all about increasing our knowledge of the unknown. Computer programs are deterministic, moving from state to state according to specific rules; there's nothing unknown about them. Well, at least until you introduce a bug into your program. And then scientific method can be extremely useful, helping you to discover the real rules that your program is using.

For those who slept through 8th grade, here's a summary of the scientific method:

  1. Gather data.
  2. Come up with a hypothesis to explain how that data could exist.
  3. Design experiments to prove that hypothesis wrong (this is the hard part).
  4. Once you've run out of experiments, call your hypothesis a theory (8th grade science teachers are now upset).
  5. Repeat.

That's right: science doesn't grow by proving hypotheses correct, it grows by proving them wrong. It's impossible to prove a hypothesis about the natural world, because someone might find data that disproves it. For example, Newtonian mechanics sufficed for the 17th and 18th centuries, but by the end of the 19th century scientists had gathered evidence that showed it didn't always apply. Einstein replaced Newtonian mechanics with general relativity in the early 20th century, and that hypothesis remains with us today. But it might be overturned tomorrow, next year, or a million years from now.

So what does that have to do with debugging?

It's a way to break free from your assumptions. When following the scientific method, your goal is not to prove your assumptions correct, but to prove them wrong. And you devote all of your effort to that proof. Only when you've exhausted all attempts to prove your assumptions wrong are you allowed to form new assumptions.

The first assumption that you need to prove wrong, of course, is that your code is correct. Which is where the Small, Self-Contained Example Program comes in.

Friday, December 18, 2009

Debugging 102: Sherlock Holmes and William of Ockham

So if assumptions are a problem, and they're almost impossible to eliminate once formed, how do you prevent them from being formed? A good first step is to examine every perceived fact with Occam's razor — or more correctly, the interpretation of Occam's razor that says “simpler is more likely.”

Looking back at my “broken” network cable, with razor in hand, I should have asked myself “how did this cable break while sitting on the floor?” There's no simple explanation for that. Cables don't break unless they experience some trauma, yet this cable was stored in an out-of-the-way place. Damage, therefore, wasn't a simple explanation; time to look for something else.

Occam's razor is also known by the tagline “SELECT isn't broken.” The belief that your program is perfect and the compiler, or DBMS, or third-party open-source library is broken is common, especially among neophyte programmers. It takes time and suppression of one's own ego to trust someone else's work, to believe that “if 10,000 programmers can use this compiler without it breaking, my code is to blame.” Of course, sometimes it is the compiler: I've discovered one or two compiler bugs in my career, along with numerous bugs in open-source libraries.

And this is where Sherlock Holmes enters the picture (as quoted from The Sign of the Four):

when you have eliminated the impossible whatever remains, however improbable, must be the truth

The key part of this quote is “when you have eliminated.” Debugging is a process: start with the most likely situation (per Occam's razor), work to eliminate it as a possibility, then move on. The process fails when you either jump too quickly to an assumption or, as in the case of my network connection, don't work to eliminate your assumptions.

And one way to eliminate possibilities, even if they're based on strongly-held assumptions, is to apply the “Scientific Process” to your debugging.

Thursday, December 17, 2009

Debugging 101: Assumptions

Story time: this weekend I was configuring a router for my wife's uncle. I needed a live upstream network connection to test it, and happened to have a spare cable plugged into my main router — a gray cable, that I'd used recently for a computer without wireless, which was coiled neatly next to my equipment rack.

I plugged this cable into the new router, and nothing happened. “Oh, that's right, the connector has a broken tab, it probably needs to be pushed back into its socket.” After five minutes of unplugging and replugging the cable, and testing it on my laptop, I decided that the cable simply wasn't working anymore, and grabbed another off the shelf. I configured the router and that was that … until I sat down at my desktop computer and couldn't connect to the Internet.

I had violated the first rule of debugging: don't assume.

In this case I assumed that the gray cable I was busy plugging and unplugging at my main router was the same gray cable that was plugged into the new router. In fact, it was the gray cable that was attached to my desktop computer. The end of the neatly coiled spare cable had long-ago fallen onto the floor (it was missing the tab on its connector, remember).

There were plenty of clues staring me in the face. For one thing, the “spare” cable was zip-tied to my equipment rack. When I saw this, I actually said to myself “why did I do that?” Another clue was that only three “connection” lights were lit on the main router. Oh, and then there was the fact that I had two gray cables lying next to each other. But I ignored these clues.

That's the nature of assumptions: once you believe something, you won't let go of that belief until you have incontrovertible evidence to the contrary. Perhaps this was a good thing for early human evolution: it's best to assume that rustling in the brush is something that plans to eat you until you see otherwise. Those who abandoned their assumptions too quickly were removed from the gene pool.

But to a software developer, it's a trait that gets in the way of debugging. Fortunately, there are a few tricks to break assumptions … as long as you remember to use them before the assumption takes hold.

More on those tomorrow.