Thursday, October 9, 2025

Things I hate about the Mazda CX-70

It's been a little over a year since I bought a CX-70. Overall, I really like it: it's comfortable, handles well, looks great inside and out, has enough cargo space for my needs, and is able to pull my 3500 pound travel trailer with ease. But there are a few things that a really don't like, to the extent that Mazda might not be on my list the next time I look for a car.

I've listed them here in increasing order of annoyance.

Turning off the stereo

There have been a lot of professional reviewers slamming the infotainment unit. I'm going to focus on one very small part of it, that nonetheless makes me grumble every time I use it: turning the stereo off so that it stays off.

The Mazda has three ways to turn off the stereo. The first is the mute button: press the small round knob in the center console and the sound stops. But if you turn off the engine it's back on as soon as you start up again. If you hold down that button, you turn off the infotainment system entirely. It won't turn on again the next time you get in the car, but you also can't use the navigation system or even see the current time.

If you actually want to turn off just the stereo, you must press the large button, to bring up a menu. Then select “Audio Sources” from the that menu. Then scroll to the very end of that list where there's an “Audio Off” menu item. Finally, press the large button to select that item.

As I see it, there are two easy solutions: either remember the setting of the mute, or move “Audio Off” to the very top of the audio menu.

“Upcoming exits” navigation sub-panel

One of the reasons that I bought the CX-70 was that it had a built-in navigation system. And while “Miss Google” is easier to use and gives better directions, I've been in many places without Internet connectivity (and where I might not have already downloaded maps). I also like the navigation screen as a default display.

But then I get on a highway, and the system shows a list of upcoming exits with their distance and estimated ETA, blocking the right third of the screen. In principle, I might like such a list, if it showed the exit names and I could scroll through them to highlight the exit I wanted. But it doesn't, and I can't, and more importantly, I can't make it go away. The UI indicates that I should be able to do that: there's a downward pointing arrow at the top of the widget, which I would interpret as “minimize this window,” but I have not found any way to activate that control (if control it is).

If you go into the navigation menus, there's an sub-menu for what appears on the sidebar. I've told it to show nothing, but that doesn't disable the exit list. Clearly the team that put that checkbox in place never talked to the team that implemented the exit sidebar.

Repeated warning messages

When the CX-70 wants to tell you something, it blanks out most of the instrument console to do so. And requires you to press the "Info" key on the steering wheel to make the message go away.

Sometimes, this is annoying, as when it tells me that my windshield washer fluid is low (especially annoying because that message appears when the fluid is half empty, due to the design of the reservoir). And sometimes it's downright dangerous, such as when it told me — in separate messages — that my front collision avoidance system was no longer operational because I was driving in a torrential downpour. Seeing your gauges replaced by a big warning box is guaranteed to attract your attention, even if you have none to spare.

What raises this behavior to major annoyance is that the conditions that trigger the message reset: in the case of the torrential downpour, once I got out of a rain band the sensors would detect that they could see what was in front of me, and the collision avoidance system would be re-enabled. Only to be disabled again, with two messages, when I entered the next rain band.

Aside from the danger and annoyance, repeated messages desensitive users. After passing through two or three rain bands that day, I forced myself to ignore the messages flashing on my screen. Which, of course, meant that I wouldn't see a truly important message, such as dangerously low tire or oil pressure.

My recommendation here is simple: only show a message once per drive. Assume that I know there's a problem until I turn off the engine. Unfortunately, I think this is unlikely to happen, for the same reason that the CX-70's Owner's Manual prefaces every feature description with a warning that in effect says “don't rely on this feature.”

Rear auto-braking due to bicycle rack

A friend of mine has a Jeep Wrangler. When he shifts into reverse with a hitch-mounted bicycle rack, the car starts beeping. The CX-70 goes one step further: it slams on the brakes. I first discovered this “feature” on our first long trip, trying to turn around in a narrow dead-end street. Even if you're moving at a slow walking speed, suddenly slamming on the brakes will bounce your head off the seatback (try it!). When that happens every few feet, it's infuriating.

There is a way to turn this feature off, buried in the menu system. But it is a useful feature, so I don't want to turn it off permanently. This would be a perfect place for the warning system I described in the last section: apply the brakes (once), display a message, and then ignore the situation once the driver acknowledges the message (this is one case where the acknowledgment should not last for the entire drive).

I ended up solving the problem with a hack. We have the factory installed trailer hitch, which disables the rear warning systems when you plug in a trailer's umbilical. So I bought a set of magnetic towing lights (used when you're towing another car or a utility trailer that doesn't have lights), and plug them in whenever we have the bicycle rack installed.

Driver personalization system

Everything up to this point has been an annoyance that, on balance, I can live with This “feature” is the reason that I don't think that I'll buy another Mazda.

Like many upscale cars, the CX-70 can save your preferences for seat, steering wheel, and mirror position. There are two buttons on the dash; one for myself, the other for my wife. And if that was all the CX-70 provided, I would be happy. But Mazda decided to add the “Driver Personalization System,” which uses facial recognition to figure out who is driving the car.

It's cool technology, right? What could go wrong? The answer: a lot.

First off, it takes a subjectively long time to figure out who the driver is in the best of cases. Objectively, I've timed it as over 10 seconds in the worst case. It doesn't seem to work at all if you have the camera display turned on. And if you shift into gear without waiting for it to finish, it gives up.

Second, it's not very good: at least half the time it doesn't figure out that it's me, even though I've “trained” it with multiple postures, with and without sunglasses. To get a good reading, you must stare at the infotainment screen and remain rigidly in place, like you're posing for an 1800s photo. Even then, the failure rate is pretty high.

Third, it appears to operate asynchronously. Not a problem, except when the ”don't look at the infotainment unit while driving” warning pops up (something that happens for every drive). If you acknowledge that warning, then the DPS seems to give up (or maybe it interprets the button press as accepting whatever driver it thinks you are).

None of this would be intolerable, if it simply defaulted to the previous driver's settings. But for some reason, Mazda decided to default to a “guest” setting. The point of this completely eludes me: if you're loaning your car to someone, why would they need their own configuration? And why would Mazda think that the next person to borrow the car would want the same settings?

And that brings me to the real problem: the Driver Personalization System doesn't just adjust the seat, mirrors, and steering wheel. It appears to remember every menu configuration item, from the position of the heads-up display (good) to the selected radio station and audio volume (not so good, although thankfully we don't have a teenager). Over the past year I've tried to make the guest settings the same as my normal settings, and every time I find a new one to change I curse the Mazda designers and developers.

So I have one recommendation: get rid of the friggin' “guest” mode and just default to the last driver.

Wrapping Up

I wrote this post at least partly to vent, and partly in the hope that a Mazda product manager might see it and instigate change (hey, it's worked for my posts critical of AWS services!).

But a bigger reason — and why it's on my programming-focused blog — is that each of these problems is a user interface failure. Likely caused by design and development teams that are working in isolation, trying to tick features off a product manager's list and meet an imposed deadline, without a QA team that acts as the voice of the customer. Fortunately, as software problems all of them can be corrected by that same development team, and installed during a scheduled service.

If enough people show their annoyance.

Saturday, December 14, 2024

Once more into the breach: Amazon EFS performance for software builds

This is the third time that I'm writing about this topic. The first time was in 2018, the second in 2021. In the interim, AWS has announced a steady stream of improvements, most recently (October) increasing read throughput to 60 MB/sec.

I wasn't planning to revisit this topic. However, I read Tim Bray's post on the Bonnie disk benchmark, and it had the comment “it’d be fun to run Bonnie on a sample of EC2 instance types with files on various EBS and EFS and so on configurations.” And after a few exchanges with him, I learned that the Bonnie++ benchmark measured file creation and deletion in addition to IO speed. So here I am.

EFS for Builds

Here's the test environment (my previous posts provide more information):

  • All tests run on an m5d.xlarge instance (4 vCPU, 16 GB RAM), running Amazon Linux 2023 (AMI ami-0453ec754f44f9a4a).
  • I created three users: one using the attached instance store, one using EBS (separate from the root filesystem), and one using EFS. Each user's home directory was on the filesystem in question, so all build-specific IO should be confined to that filesystem type, but they shared the root filesystem for executables and /tmp.
  • The local and EBS filesystems were formatted as ext4.
  • The EBS filesystem used a GP3 volume (so a baseline 3000 IOPS).
  • The EFS filesystem used Console defaults: general purpose, elastic throughput. I mounted it using the AWS recommended settings.
  • As a small project, my AWS appenders library, current (3.2.1) release.
  • As a large project, the AWS Java SDK (v1), tag 1.11.394 (the same that I used for previous posts).
  • The build command: mvn clean compile.
  • For each project/user, I did a pre-build to ensure that the local Maven repository was populated with all necessary dependencies.
  • Between builds I flushed and cleared the filesystem cache; see previous posts for details.
  • I used the time command to get timings; all are formatted minutes:seconds, rounded to the nearest second. “Real” time is the elapsed time of the build; if you're waiting for a build to complete, it's the most important number for you. “User” time is CPU time aggregated across threads; it should be independent of disk technology. And “System” time is that spent in the kernel; I consider it a proxy for how complex the IO implementation is (given that the absolute number of requests should be consistent between filesystems).

And here are the results:

  Appenders AWS SDK
  Real User System Real User System
Instance Store 00:06 00:16 00:01 01:19 02:12 00:09
EBS 00:07 00:16 00:01 01:45 02:19 00:09
EFS 00:18 00:20 00:01 15:59 02:24 00:17

These numbers are almost identical to the numbers from three years ago. EFS has not improved its performance when it comes to software build tasks.

What does Bonnie say?

As I mentioned above, one of the things that prompted me to revisit the topic was learning about Bonnie, specifically, Bonnie++, which performs file-level tests. I want to be clear that I'm not a disk benchmarking expert. If you are, and I've made a mistake in interpreting these results, please let me know.

I spun up a new EC2 instance to run these tests. Bonnie++ is distributed as a source tarball; you have to compile it yourself. Unfortunately, I was getting compiler errors (or maybe warnings) when building on Amazon Linux. Since I no longer have enough C++ knowledge to debug such things, I switched to Ubuntu 24.04 (ami-0e2c8caa4b6378d8c), which has Bonnie++ as a supported package. I kept the same instance type (m5d.xlarge).

I ran with the following parameters:

  • -c 1, which uses a single thread. I also ran with -c 4 and -c 16 but the numbers were not significantly different.
  • -s 32768, to use 32 GB for the IO tests. This is twice the size of the VM's RAM, the test should measure actual filesystem performance and rather than the benefit of the buffer cache.
  • -n 16, to create/read/delete 16,384 small files in the second phase.

Here are the results, with the command-lines that invoked them:

  • Local Instance Store: time bonnie++ -d /mnt/local/ -c 1 -s 32768 -n 16
    Version 2.00a       ------Sequential Output------ --Sequential Input- --Random-
                        -Per Chr- --Block-- -Rewrite- -Per Chr- --Block-- --Seeks--
    Name:Size etc        /sec %CP  /sec %CP  /sec %CP  /sec %CP  /sec %CP  /sec %CP
    ip-172-30-1-84  32G  867k  99  128m  13  126m  11 1367k  99  238m  13  4303 121
    Latency              9330us   16707us   38347us    6074us    1302us     935us
    Version 2.00a       ------Sequential Create------ --------Random Create--------
    ip-172-30-1-84      -Create-- --Read--- -Delete-- -Create-- --Read--- -Delete--
                  files  /sec %CP  /sec %CP  /sec %CP  /sec %CP  /sec %CP  /sec %CP
                     16 +++++ +++ +++++ +++ +++++ +++     0  99 +++++ +++ +++++ +++
    Latency               146us     298us     998us    1857us      18us     811us
    1.98,2.00a,ip-172-30-1-84,1,1733699509,32G,,8192,5,867,99,130642,13,128610,11,1367,99,244132,13,4303,121,16,,,,,+++++,+++,+++++,+++,+++++,+++,4416,99,+++++,+++,+++++,+++,9330us,16707us,38347us,6074us,1302us,935us,146us,298us,998us,1857us,18us,811us
    
    real	11m10.129s
    user	0m11.579s
    sys	1m24.294s
         
  • EBS: time bonnie++ -d /mnt/ebs/ -c 1 -s 32768 -n 16
    Version 2.00a       ------Sequential Output------ --Sequential Input- --Random-
                        -Per Chr- --Block-- -Rewrite- -Per Chr- --Block-- --Seeks--
    Name:Size etc        /sec %CP  /sec %CP  /sec %CP  /sec %CP  /sec %CP  /sec %CP
    ip-172-30-1-84  32G 1131k  99  125m   8 65.4m   5 1387k  99  138m   7  3111  91
    Latency              7118us   62128us   80278us   12380us   16517us    6303us
    Version 2.00a       ------Sequential Create------ --------Random Create--------
    ip-172-30-1-84      -Create-- --Read--- -Delete-- -Create-- --Read--- -Delete--
                  files  /sec %CP  /sec %CP  /sec %CP  /sec %CP  /sec %CP  /sec %CP
                     16 +++++ +++ +++++ +++ +++++ +++ +++++ +++ +++++ +++ +++++ +++
    Latency               218us     303us     743us      69us      15us    1047us
    1.98,2.00a,ip-172-30-1-84,1,1733695252,32G,,8192,5,1131,99,128096,8,66973,5,1387,99,140828,7,3111,91,16,,,,,+++++,+++,+++++,+++,+++++,+++,+++++,+++,+++++,+++,+++++,+++,7118us,62128us,80278us,12380us,16517us,6303us,218us,303us,743us,69us,15us,1047us
    
    real	16m52.893s
    user	0m12.507s
    sys	1m4.045s
         
  • EFS: time bonnie++ -d /mnt/efs/ -c 1 -s 32768 -n 16
    Version 2.00a       ------Sequential Output------ --Sequential Input- --Random-
                        -Per Chr- --Block-- -Rewrite- -Per Chr- --Block-- --Seeks--
    Name:Size etc        /sec %CP  /sec %CP  /sec %CP  /sec %CP  /sec %CP  /sec %CP
    ip-172-30-1-84  32G  928k  98  397m  27 60.6m   6  730k  99 63.9m   4  1578  16
    Latency              8633us   14621us   50626us    1893ms   59327us   34059us
    Version 2.00a       ------Sequential Create------ --------Random Create--------
    ip-172-30-1-84      -Create-- --Read--- -Delete-- -Create-- --Read--- -Delete--
                  files  /sec %CP  /sec %CP  /sec %CP  /sec %CP  /sec %CP  /sec %CP
                     16     0   0 +++++ +++     0   0     0   0     0   1     0   0
    Latency             22516us      18us     367ms   24473us    6247us    1992ms
    1.98,2.00a,ip-172-30-1-84,1,1733688528,32G,,8192,5,928,98,406639,27,62097,6,730,99,65441,4,1578,16,16,,,,,218,0,+++++,+++,285,0,217,0,944,1,280,0,8633us,14621us,50626us,1893ms,59327us,34059us,22516us,18us,367ms,24473us,6247us,1992ms
    
    real	23m56.715s
    user	0m11.690s
    sys	1m18.469s
         

For the first part, reading large block files, I'm going to focus on the “Rewrite” statistic: the program reads a block from the already created file, makes a change, and writes it back out. For this test, local instance store managed 126 MB/sec, EBS was 65.4 MB/sec, and EFS was 60.6 MB/sec. Nothing surprising there: EFS achieved its recently-announced throughput, and a locally-attached SSD was faster than EBS (although much slower than the 443 MB/sec from my five-year-old laptop, a reminder that EC2 provides fractional access to physical hardware).

The second section was what I was interested in, and unfortunately, the results don't give much insight. In some doc I read that "+++++" in the output signifies that the results aren't statistically relevant (can't find that link now). Perhaps that's due to Bonnie++ dating to the days of single mechanical disks, and modern storage systems are all too fast?

But one number that jumped out at me was “Latency” for file creates: 146us for instance store, 218us for EBS, but a whopping 22516us for EFS. I couldn't find documentation for this value anywhere; reading the code, it appears to measure the longest time for a single operation. Which means that EFS could have 99% of requests completing in under 100ms but a few outliers, or it could mean generally high numbers, of which the one stated here is merely the worst. I suspect it's the latter.

I think, however, that the output from the Linux time command tells the story: each of the runs uses 11-12 seconds of “user” time, and a minute plus of “system” time. But they vary from 11 minutes of “real” time for instance store, up to nearly 24 minutes for EFS. That says to me that EFS has much poorer performance, and since the block IO numbers are consistent, it must be accounted for by the file operations (timestamps on the operation logs would make this a certainty).

Conclusion

So should you avoid EFS for your build systems? Mu.

When I first looked into EFS performance, in 2018, I was driven by my experience setting up a build server. But I haven't done that since then, and can't imagine that too many other people have either. Instead, the development teams that I work with typically use “Build as a Service” tools such as GitHub Actions (or, in some cases, Amazon CodeBuild). Running a self-hosted build server is, in my opinion, a waste of time and money for all but the most esoteric needs.

Wo where does that leave EFS?

I think that EFS is valuable for sharing files — especially large files — when you want or need filesystem semantics rather than the web-service semantics of S3. To put this into concrete terms: you can read a section of an object from S3, but it's much easier codewise to lseek or mmap a file (to be fair, I haven't looked at how well Mountpoint for Amazon S3 handles those operations). And if you need the ability to modify portions of a file, then EFS is the only real choice: to do that with S3 you'd have to rewrite the entire file.

For myself, I haven't found that many use cases where EFS is the clear winner over alternatives. And given that, and the fact that I don't plan to set up another self-hosted build server, this is the last posting that I plan to make on the topic.

Friday, September 6, 2024

My Thoughts on CodeCommit Deprecation

AWS's recent fait accompli deprecation of CodeCommit and six other services was a shock to me.*

Not because CodeCommit was a particularly good product — it wasn't — but because it could have been one with some investment. While there are many Git repository services in the world, CodeCommit was part of the AWS ecosystem, giving it some unique capabilities. Capabilites that AWS never exploited.

CodeCommit was released at re:Invent 2014, and became generally available the following summer. At some point after that, I moved a couple of repositories that I'd been self-hosting. At the time, GitHub didn't support private repositories, and I was happy to pay AWS a few cents a month to ensure that they were available anywhere and safely backed-up.

The first thing I noticed about CodeCommit was that it was painfully slow. To put some numbers on that: an HTTPS clone of my appenders library (~10,000 objects, 2.6 MiB) from GitHub takes 0.917 seconds. From the identical repository on CodeCommit, the time is 7.407 seconds. My website, which has fewer objects but more bytes, takes 22 seconds. While you might not be frequently cloning repositories, pulls and pushes are also much slower than with GitHub.

I was also annoyed that I had to set up an association between my private key and a CodeCommit user: I have several machines, each with their own private key. Making this more annoying, the key associations don't provide any indication of which key they represent; it would have been nice to see the associated public key, or even a key fingerprint.

But as I learned later, I didn't need to make those associations. CodeCommit has a git credential helper that generates temporary credentials based on IAM identity. It's not terribly well documented, and an experienced Git user probably wouldn't look at the documentation anyway (at least, I didn't), especially since the “helpful hints” shown after creating a repository make no mention of it.

Highlighting this one feature would have made CodeCommit a far more useful tool than it was. For example, a CI/CD pipeline running on AWS infrastructure wouldn't need to store credentials to access the source repository. But there's no suggestion that users could do that, even in AWS's own CodeBuild user guide (which gives examples for GitHub, BitBucket, and GitLab).

Or, as an example closer to my own needs: five years ago I submitted an issue to the “CloudFormation roadmap”, asking for the ability to retrieve templates from arbitrary HTTPS URLs (and, based on the stars and comments, this seems to be a common wish). While I can understand reluctance to allow generic public repository URLs as a security risk (somebody, somewhere, would check in something they shouldn't), CodeCommit and role-based credentials would allow CloudFormation to easily support private templates. But with CodeCommit's deprecation, that's a lost cause.

Historically, AWS has made a big deal of “dog-fooding” their services; I don't think this happened with CodeCommit. If you want to download SDK source, or any other AWS-provided open source, you go to GitHub. Although, given how slow CodeCommit is, maybe we should be thankful; something like the Java SDK already takes an enormously long time to download. But without AWS using CodeCommit internally, there was no pressure to improve. And no serendipitous “hey, we can do X!” moments.

So what? Anybody who signed up for CodeCommit can still use it, right? And perhaps it was just hubris on AWS's part to compete with companies that already produced developer tooling and the “Code” suite should never have been released in the first place.

But for me, it's yet another sign that AWS has moved away from “now go build.” And that was what attracted me to AWS in the first place.


* “Fait accompli” because they did not announce their plans in advance, instead using blog posts like this one, which was released after they'd already blocked new users.

Friday, June 14, 2024

CloudTrail + GenAI = Disappointment

AWS just announced a natural language query generator for CloudTrail Lake. Using it, you can write prompts like “What are my top errors in the past month?” and it will spit out the SQL to get the answer. On the surface, that seems great: CloudTrail events can be very complex: they hold the request and response data for thousands of unrelated API operations. In my experience, extracting the information you need can take multiple minutes with a search engine, and longer if you use a tool such as Athena.

Unfortunately, as the title of this post tells you, it doesn't quite live up to expectations. In this post I highlight four queries that I think are simple and likely to be frequently used, but which show what's lost in translation from natural language.

Note 1: I ran the queries in this post on June 12, 2024, the same week that the query generator was announced in preview. I expect it to go through continuous training, so you might not get the same output that I did. I don't plan to make this an evergreen post, and will not update it if the queries change. It calls out the state of the world at one partiular point in time.

Note 2: I made minor changes to identifiers in the generated queries, in case there's information about my account embedded within. I did not change the queries in any other way, including formatting.

Query #1: who started ec2 instance i-0fe20093cf243bca1

Sometimes you find an instance running, and have no idea why it exists. To answer that question, you need to talk to the person who started the instance.

SELECT userIdentity.arn,
    eventName,
    eventTime,
    awsRegion,
    responseElements
FROM c40adde3-0909-92d8-b4cf-6b821599a449
WHERE eventName = 'RunInstances'
    AND element_at(responseElements, 'instancesSet') LIKE '%i-0fe20093cf243bca1%'
    AND eventTime <= '2024-06-12 17:00:00'
ORDER BY eventTime DESC
LIMIT 1;

This query does what it's supposed to, and is not necessarily something that's easy to write off the top of your head: you need to know how to find the instance ID in the event's responseElements sub-object. Fortunately, the query generator does. But there are a few quirks, that I think should be called out. The first is that this query exhibits “do what I mean, not what I say” behavior.

There are two EC2 API calls that look very similar: StartInstances and RunInstances. The former restarts an existing, stopped instance; the latter starts a new instance. In maybe 99% of the cases, you (or at least I) actually want the latter API call when we use the word “start”. So it's great that the query generator picks it … until it doesn't, perhaps because the model has been retrained. A person experienced with CloudTrail will see that it's looking for the wrong API call; a novice won't, and will assume that the instance was started before the available data.

The second quirk is the condition on eventTime. It adds nothing to the query, and in fact can make it miss results: I generated this query at 17:44 UTC, so if the instance was started in the previous 45 minutes it wouldn't appear in the results.

I also found the ORDER BY and LIMIT clauses strange: they only make sense if instance IDs can be reused (which as far as I know, they can not).

Query #2: who started ec2 instances today

This query is less common, but might be useful to identify whether an person who shouldn't be authorized to start instances is, in fact, able to start them.

SELECT userIdentity.arn,
    eventName,
    eventTime,
    recipientAccountId,
    awsRegion,
    responseElements
FROM c40adde3-0909-92d8-b4cf-6b821599a449
WHERE eventName = 'RunInstances'
    AND eventTime >= timestamp '2024-06-12 00:00:00'
    AND eventTime <= timestamp '2024-06-12 23:59:59'

This isn't quite what I asked: it's listing all of the events, not just the list of identities. To give me what I want, it should use distinct userIdentity.arn, and get rid of all of the other fields in the select-list. I suspect, however, that the training data was focused on retrieving individual records, so that's what the query generator “thought” people would want.

A more subtle issue is the date range. If you're familiar with the details of CLoudTrail events, you know that event timestamps are UTC. But if you're not familiar — in other words, the type of person who would find a query generator useful — you might think incorrectly that the timestamps are local time. I tried appending “local time” to the query, but it had no effect; all date ranges in generated queries are UTF

Query #3: how many EC2 instances were started today

I could imagine this query being used by someone investigating the cost of their EC2 fleet. Unfortunately, the generated query makes a rather large mistake.

SELECT COUNT(*) AS instances_started
FROM c40adde3-0909-92d8-b4cf-6b821599a449
WHERE eventName = 'RunInstances'
    AND eventtime >= '2024-06-12 00:00:00'
    AND eventtime <= '2024-06-12 23:59:59'
    AND eventsource = 'ec2.amazonaws.com'

This query actually counts the number of requests to start instances. In many cases, one request means one instance, but that's certainly not true in all cases. There are plenty of times when you (or your automated scripts) might spin up a fleet of instances in a single request.

To get the actual count, you must know that the responseElements object in the raw event contains an instancesSet sub-object, which in turn has an items element that's an array of information about the actual instances created. And you can use that information to write a SELECT clause like this:

SELECT sum(json_array_length(json_extract(responseElements['instancesSet'], '$.items'))) AS instances_started

This is a case where a query generator should be great, because its model could incorporate information about the contents of each event type. Unfortunately, large language models only “knows” what they have seen in their training data. The first query I showed above indicates that this model has some information about the deep event structures, but not enough to go past the basics.

Query #4: who started ec2 instance with tag "foobar"

This query seems as simple as my first. But the output has entered the realm of hallucination.

SELECT useridentity.arn,
    useridentity.username
FROM c40adde3-0909-92d8-b4cf-6b821599a449
WHERE eventname = 'RunInstances'
    AND resources [0].type = 'EC2'
    AND resources [0].tags ['foobar'] IS NOT NULL
    AND eventtime >= '2024-06-12 00:00:00'
    AND eventtime <= '2024-06-12 23:59:59'
GROUP BY 1,
    2

First off, I have no idea where that date range came from; it's not in my prompt. I suspect that it was sent to the query generator as historical context, based on my previous queries. But it shouldn't be.

The conditions on resources are also hallucinations. Multiple hallucinations.

The first, and biggest, is that resources isn't a valid field for this query. There are some events that have a resources element: AssumeRole, for example. But RunInstances does not have this element; the resources that you see listed in the CloudTrail Console are all extracted from the event data programmatically. When I first saw this query I thought that the CloudTrail Lake transformation might be doing this extracton. But when I queried the data I found that the value of that column was always null for RunInstances, so clearly it isn't.

The second hallucination is that the zero element of the resources array contains information about the instance (and assumes that there's only one instance). Like I said, the resource list in the CloudTrail Console is built programmatically, so can't really be used as a guide, but it showed the instance as the fourth element of the array in the event I was viewing.

Third, the type field, for those events that have resources, is a qualified name such as AWS::IAM::Role. The CloudTrail Console uses AWS::EC2::Instance for the instance entry, not EC2, so that's what I would expect to see (if the RunInstances event did, in fact, have resources).

And lastly, I don't believe the tags element exists. I don't see it in any of the events that do have resources, and it doesn't appear in the (programatically generated) resource list in the CloudTrail Console. But this condition is at least plausible; when I tried this same prompt on June 11, it came back with a condition involving the resource ARN.

All of these hallucinations mean that this query will never return results, whether or not there's an actual instance tagged “foobar”

The one good thing about this query is that it eliminates the extra fields in the select-list. And it adds useridentity.username, which is useful even if it's only populated when an actual IAM user is responsible for the operation (which, in a world moving away from IAM users and to Identity Center, will be infrequent).

Wrapping Up

I spun up my first EC2 instance in 2008. And since then, I've usually been delighted by new AWS services, even if they had rough edges. I haven't feel that way since AWS decided to focus on gen-AI.

I don't have anything against generative AI per se (well, other than copyright infringement and the possibility to leak confidential information). I think it's great when helping an inexperienced writer organize and polish their thoughts (but hopefully they learn from the experience). And I have a friend who uses it as a “better search” when he's working with something new (but he always backs that up by reading the documentation, never blindly taking the output of the model).

But when it comes to programming, gen-AI always seems to miss the mark. I've written elsewhere about my experiences with Amazon CodeGuru reviewer. A friend recently told me that his company abandoned using Amazon CodeWhisperer to help them write CDK scripts; you'd think that would be a place where it would excel, having a large corpus of training data. And I quickly got bored with trying to use ChatGPT to generate a non-trivial progamming construct.

I think that the reason is that large language models are very good at representing syntax, but that's only a small part of programming. Programming is much more about data: its structure and how it changes over time. And also about the causal and temporal relationships between pieces of code. Syntax is essential, but it's not sufficient.

So my job is probably safe until AI actually learns how to reason, if it ever does. But what about the CloudTrail query generator?

To be honest, I don't see the market. People who use CloudTrail all the time probably use a homegrown search engine or a commercial SIEM. So that leaves novices, people who might need an occasional query as part of their workload. But given the quality of the output, I think they're likely to get frustrated very quickly and walk away (or worse, decide that the query output is correct). Perhaps the model will get better over time, but as the saying goes, you only get one chance to make a first impression.

Tuesday, May 28, 2024

My Tests Are Good At Finding AWS Bugs

I recently made a minor change to my logging library. And, minor though it was, I run a full suite of integration tests before any release. I wasn't expecting any problems, so was surprised when the first test against Kinesis failed. More puzzling: the primary assertions in the test all passed; the records were properly written to the stream. What failed was an assertion that there weren't any internally-logged errors.

Digging in, I discovered that the failure was a ResourceNotFoundException: Kinesis was claiming that the stream didn't exist! This particular test created the stream, waited for it to become active, and then immediately tried to write a batch of messages to it. I looked through the code to see if there was any way that it could be writing the batch before the stream was active, and didn't see one. I then put debugging messages into the code to be sure. The stream was definitely active when the batch was written.

I then extracted the code into a stand-alone program,** and discovered that PutRecords claimed that a newly-created stream didn't exist, even after a dozen or more calls to DescribeStreamSummary said that yes, it did. And a second call to PutRecords, invoked immediately afterward, succeeded. It seems that their internal name->ARN lookup service has a race condition.

Since my company has business-tier support with AWS, I submitted a ticket that included the demo program. And 24 hours later received a message asking for additional information, including “a detailed system architecture.” I'm tempted to rant about AWS support, but I'm sure they're overwhelmed. At least they don't use Q to handle first-tier response — yet. I also pinged a friend who works for AWS, but haven't heard back via that channel either.

I also did some digging and discovered that I could work around the problem by (1) passing the stream ARN to PutRecords instead of the name, or (2) inserting a one-second sleep between receiving the “active” status and trying to send the batch.

As far as the log-writer itself is concerned, the error isn't a problem: it retries the send. That's why the primary assertions succeed: all of the messages are in fact written. So my decision is whether to wait for AWS to fix the problem or change my tests to work-around it. Or change the library to use ARN, on the assumption that that's the “preferred” argument for the PutRecords call.


* In case you're wondering about the title, you can read about my last experience here.

** A Python program that displays the behavior is here.

Monday, March 4, 2024

Ordinary Users Don't Stand a Chance

I have a “tax PC”: an old HP running Windows 10, that spends ten months of the year in a closet, and two months hooked up to a segment of my home network where it's unlikely to be attacked by the various network-attached devices living in my house. Each February I spend a couple of days applying the year's accumulated Windows updates, then I install Turbo-Tax so that I can do my taxes.

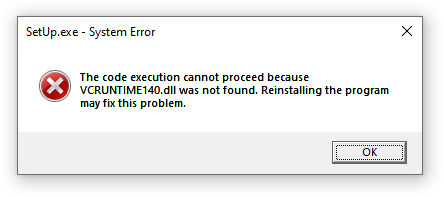
This year the Turbo-Tax installation failed:

Turbo-Tax installation error

I Google for the missing DLL, and end up on a Microsoft-hosted discussion board where the first answer says that I need to update my Visual C++ runtime, and provides a link to some third-party software site.

I look in my computer's list of applications and see that I have the “2010” runtime. Apparently that isn't something that Windows Update considers important. So I go to a Microsoft-hosted page, download the x64 version of the runtime (because the Windows “About” page tells me that I have an x64 computer with 64-bit OS installed), and … get the same error.

Perhaps Turbo-Tax isn't using the latest Visual C++ (never mind that the runtime advertises itself as being for 2015 onward). So I downloaded and installed the x64 versions the other runtimes, rebooted, and tried again. And the installer failed again.

Intuit provides a page titled “Troubleshoot installation and running TurboTax for Windows.” This page is the first result if you go to their Support page and search for the DLL name. It tells you to do things like “Check your TurboTax CD and computer's CD drive” and “Clean up and defragment your hard drive.”

I kept digging through search results, and eventually I found a discussion board posting in which someone says that they had to install the x86 version of the Visual C++ runtime. OK, that makes sense: lowest-common denominator, X86 libraries work on an x64 processor. So I did that, installed, rebooted, and the installer ran successfuly. According to a comment on that thread, the runtime should have been provided on the Turbo-Tax CD but wasn't.

I've been a professional software developer for 40 years. I don't use Windows, but I know what a DLL is, and I'm comfortable with searching the web for answers. More important, I can identify a sketchy answer, and don't download from random links on the Internet. But what about people that don't have that knowledge?

Maybe there aren't any other people who run Turbo-Tax locally, installing from physical media. Or maybe everybody else installs on their brand-new PC running Windows 11, with all the latest runtimes installed. But I have to believe that I'm not unique. There must be other people that have run into this problem.

What do they do?

Thursday, July 13, 2023

Buggy Behavior From The CloudWatch Logs API

Tip 26: “select” isn't broken.
The OS is probably not broken. And the database is probably just fine.

The Pragmatic Programmer

Words to live by — although I did once find a problem with Oracle's index management, which manifested in select. In my opinion, it's the maxim that defines a senior developer. Junior developers always look outside themselves whenever they run into a problem. Senior developers do everything they can to find where they've made a mistake. After all, there are a lot of people doing exactly the same things that you are; surely they would have found the bug first.

But sometimes, it really is a bug in the system. This post is a story of how I determined the bug wasn't in my code. It's part catharsis, part “here's what you should do if you think select is broken,” and part calling out the issue for posterity in case someone else trips over it.

In January of this year (2023), AWS made a change in the CloudWatch Logs API: you no longer needed to provide a sequence token when calling PutLogEvents. Sequence tokens were always, I think, a “leaky abstraction”: a part of the internal implementation of CloudWatch Logs that found its way into the API. To summarize: you had to retrieve a sequence token before you could write events. When you wrote a batch of events, you received a sequence token back, which you could use to write the next batch — unless another process was writing to the same stream, in which case your sequence token would become invalid. Which meant that you had to retrieve a new token, using an API that had a relatively low limit on number of requests per second. With enough concurrent writers, hilarity would ensue as each would retrieve a token, try to use it, and fail because some other writer got there first.

This change directly impacted my logging library, but initially I wasn't planning to adopt it: the library worked, the old behavior was supported, and to be honest, releasing the library involves a lot of toil. But then someone found a bug with my sequence-token retrieval code if the logging library happened to re-initialize itself (Log4J2 FTW!). I fixed the immediate bug, and released a patch, but then decided it was a sign from the universe that I should remove the sequence token entirely. Plus, it always feels good to delete code!

However, once I changed the code, one of my integration tests — the one that pits concurrent writers against each other — started failing. When it tried to verify the events that were written, it would often come up short.

Failing integration tests are nothing new to this library: CloudWatch is an “eventually consistent” system, and while “eventually” often means seconds, it sometimes takes longer for the service to become consistent. As a result, failing tests don't clean up after themselves, so that I can look at what happened. I could then use my log reader utility, and verify that all of the events were eventually available.

This time, I didn't get all of the events back. Of course, I assumed that my reader was incorrect, and dove back into the documentation for the API calls it was using. I experimented with different arguments to the GetLogEvents call, and also tried FilterLogEvents. But nothing I did had an effect: I was still missing log entries.

Next step was to dig into the logging library. I already had it fairly well instrumented: if you enable debug mode in the logging framework it will report everything that it does, including (optionally) every batch that it sends. Everything looked good, but there was a corner case that worried me: CloudWatch can reject events, and unlike Kinesis, it doesn't tell you which events it rejects. The appender pre-processed batches to remove invalid events, but didn't log failures (because there shouldn't be any). I changed that code, but no failures appeared.

At this point I didn't think the bug was in my appender, but there was always the possibility that I was doing something incorrectly that I didn't log. My next step for debugging the appender would have been to turn up the logging level within the AWS SDK, to get a detailed report of what it was doing. However, this can become a case of drowning in detail, so first I looked at alternative methods of verifying the events.

In addition to the GetLogEvents and FilterLogEvents API calls, CloudWatch provides a query API. This API requires you to submit a query and then loop until it's done, so I didn't have a utility program that used it. But it's what the Console uses in the Insights page.

So I wrote a simple query to retrieve events from the stream; I was actually more interested in the reported count, rather than looking at all 20,000 expected events. But Insights told me that there weren't any events in the stream.

At this point, I opened a ticket with AWS Support (fortunately, I have access to an account with a Business support contract, since “Basic” support no longer allows technical questions). I received an answer that “as designed,” Insights does not return any messages with timestamps prior to the log group's creation time. WTF?!?

The back-story is that my Log4J 1.x appender lazily creates the log group and stream when it first writes a batch of messages, because Log4J 1.x does not have an explicit initialization phase. This is definitely something to be aware of if you use my library with Log4J 1.x (and, overwhelmingly, that's what my download counts indicate people are doing). The solution is to pre-create your log groups, so I modified the test to do so. This is not an issue with Log4J 2.x and Logback, which do have an initialization phase.

But the test continued to fail. However, I could view the logs in Insights, and saw that it was able to retrieve all of the events (yet another approach, which also succeeded, is export to S3). And more interesting, it was the initial few log messages that weren't being retrieved by GetLogEvents. I also called the DescribeLogStreams API, and it returned a later “first event timestamp” than expected, by a few milliseconds.

This seemed worth another Support ticket: if I could retrieve all log events using one technique, and not using another, then clearly it was a problem with CloudWatch and not me.

And now comes the most important lesson from this entire adventure: do not assume that the AWS Support rep can see what you're describing, and more important, do not expect them to tell you that they can't.

I had created a log group/stream that demonstrated the problem, referenced it in the ticket. I also attached the S3 export, the list of events from my log reader, and the initial events from an Insights query. The support rep seemed to agree that there was a problem. Then for a week they wrote nightly updates about how they were trying to re-upload the events and did not see a problem. They seemed to be trying random things, so I recommended building my library and running the integration test — at this point, my assumption was that AWS accepted that there was a problem based on my example group/stream, and were simply trying to re-create at will.

It turned out this was an incorrect assumption, which I learned when the original rep went dark and a new rep picked up the case. I had independently created a program that triggered the issue, so that they wouldn't have to run the integration tests. The new rep claimed to have run the program, did not see the issue, and pointed out that AWS did not have permission to view the original log group and stream that I had identified in the ticket!

Seeing that the “web” interactions were not having any effect, I decided to try a chat session with a screenshare. I showed the rep the original group and stream, and how different retrieval methods returned different results. At the time it didn't seem to have much effect: he made sounds of acknowledgement, but was unable to assume the role I created to let him read events, and would go silent for minutes at a time while he was “try[ing] something.” All-in-all, not a great experience from my side.

But it did seem to have an effect: the next morning I got a message from someone who claimed to be on the CloudWatch team, saying that they were able to re-create the problem. And that's where it stands today. For my part, the updates to my library are on hold until I hear back: while this may be superstition on my part, it seems to work better if I provide a sequence token (I suspect it's actually the delay from retrieving the token).

And if you run into a problem with GetLogEvents not returning all of your events, feel free to reference case #12882575541 if you file a Support ticket.

Update, 2023-08-22

AWS has resolved the problem: "We investigated and found that there was an issue with the service which in rare situations can incorrectly set the "firstEventTimestamp" on a log-stream [...] Our team has now fixed the issue with GetLogEvents not returning some events due to incorrectly set "firstEventTimestamp"." Have verified that my integration tests run (repeatedly) without a failure. It took just under three months (05/23 to 08/18) to resolve the case, two months (06/15) from the point that someone took it seriously. For a company the size of AWS, and a service with the reach of CloudWatch Logs, that seems pretty fast; I've had issue drag on far longer with in-house IT teams.

Tuesday, January 3, 2023

Using EventBridge Pipes to route CloudWatch Logs events to Kinesis

Several years ago I wrote about connecting CloudWatch Logs into into a logging pipeline built on Kinesis Streams and Kinesis Firehose. To make that work, I wrote a Lambda.

AWS announced EventBridge Pipes at re:Invent 2022, as an easy way to connect messaging services. Connecting CloudWatch Logs to Kinesis seemed like a good way to kick the tires on this service. It still requires a custom Lambda, but that Lambda is now much simpler, because it doesn't need to concern itself with the quirks of PutRecords.

The Problem

When you subscribe a Kinesis stream to a log group, CloudWatch writes messages that look like this:

H4sIAAAAAAAAA62QTU7DMBCF95zC8jqO7LHd2NkFNVRCdNWyggqF1gqG/MlxW6qqd2cK7QWA5bw382a+OdLWjWNVu+VhcDSn02JZvMzLxaKYlTSh/b5zAWUBUulJZiwXgHLT17PQbwd0imFw3caF8rNqh8b9mIsYXNWi+9DX6l6wi8mAAwgAxXx88413HZNaWDHBqXH7Oq6DH6LvuzvfRBdGmj/Ra+zqO7fcuS6e9SP1G4yXGRgltdLcGK41SKu0AQ2KC55hrYTNsJCWc5CCW5CgteEG90WP4BHDaS4mmTDGAOKBTa4PwfjzuUwAA0W4yUHl0iTYQqbl7eOMPLkLFV+Rdd+mH5s6uLoPhxQvVe9ptR/TS0s6r3xHGNlVzdYRPxINzx09JX/DsP+LIX6LsTrdfAHRwAP2RwIAAA==

That's a GZipped and Base64-encoded JSON object. When decoded, unzipped, and pretty-printed, it looks like this:

{
  "messageType": "DATA_MESSAGE",
  "owner": "123456789012",
  "logGroup": "AppenderExample",
  "logStream": "Log4J1-Example-20221224-ithilien-351916",
  "subscriptionFilters": [
    "Example"
  ],
  "logEvents": [
    {
      "id": "37284354508805523945825240107552419724039002310923255808",
      "timestamp": 1671888278929,
      "message": "2022-12-24 08:24:38,929 DEBUG [example-0] com.kdgregory.log4j.aws.example.Main - value is 52\n"
    },
    {
      "id": "37284354508805523945825240107552419724039002310923255809",
      "timestamp": 1671888278929,
      "message": "2022-12-24 08:24:38,929 DEBUG [example-1] com.kdgregory.log4j.aws.example.Main - value is 52\n"
    }
  ]
}

As you can see, CloudWatch combines multiple log events into a single message. However, most destinations — such as Elasticsearch — want individual events, not a nested array. So you need something that pulls apart the original event. For example, the AWS-provided OpenSearch integration, which subscribes a Lambda to the log group, decomposes the messages, and writes them to the cluster. My previous implementation did a similar transformation, but wrote the log messages to a Kinesis stream.

EventBridge Pipes

EventBridge Pipes is modeled around a four-step process (image sourced from docs):

EventBridge Pipes data flow

For simple pipelines, EventBridge gives you a “no code” solution that eliminates the middle two steps: you define an output format using path references to fields in the input messages. Unfortunately, this isn't usable for CloudWatch Logs messages: it can't (currently) handle Gzipped data, and can't extract the elements in an array. So we need to add an “enrichment” step that performs this operation.

Implementation

You can implement the enrichment step in multiple ways, including an HTTP(S) API, but the easiest is a Lambda. Pipes invokes this Lambda with an event that contains one or more source records, and it returns returns zero or more result records.

The source event looks like this:

[
  {
    "eventSource": "aws:kinesis",
    "eventVersion": "1.0",
    "eventID": "shardId-000000000000:49636526735590005452916707570422271019264002608211165186",
    "eventName": "aws:kinesis:record",
    "invokeIdentityArn": "arn:aws:iam::123456789012:role/CloudWatchTransformPipeline-PipeRole-us-east-1",
    "awsRegion": "us-east-1",
    "eventSourceARN": "arn:aws:kinesis:us-east-1:123456789012:stream/log-subscription",
    "kinesisSchemaVersion": "1.0",
    "partitionKey": "87362ce96c65eb1b3125bf0129b99bee",
    "sequenceNumber": "49636526735590005452916707570422271019264002608211165186",
    "data": "...",
    "approximateArrivalTimestamp": 1672490859.613
  }
]

The first thing to call out is that this event is an array. EventBridge Pipes can batch messages together, so you must loop over the entire event and combine the results from each message (ie, a flat-map):

def lambda_handler(event, context):
    result = []
    for message in event:
        result += transform_messages(message)
    return result

The data element is the GZipped and Base64-encoded message that I showed above. You process it with code that looks like this:

data = base64.b64decode(message['data'])
data = gzip.decompress(data)
payload = json.loads(data)

The last thing to be aware of is that there are two types of messages that you'll get from a CloudWatch Logs subscription, identified by the messageType field. When the subscription first starts, CloudWatch sends a control message to the stream to verify that it can write messages. After that, it sends data messages. Your Lambda should ignore everything but the latter.

if payload['messageType'] == 'DATA_MESSAGE':
    # extract log events
else:
    return []

Conclusion

This post has shown you the basics of an EventBridge Pipes transform. You can find my complete example, which performs several transforms on the log events, here.

While I don't think that EventBridge Pipes quite lives up to the hype of Werner Vogels' keynote (and that it has nothing in common with EventBridge other than a name), it does allow you to focus on your logic rather than the quirks of your source and destination. As such, it's a useful addition to your data transformation toolbox.

Sunday, January 1, 2023

Does that i4i.metal instance really help your build times?

Here in Philadelphia, the last day of 2022 was rainy and foggy; a day to stay inside. That, combined with $100 in AWS credits that were due to expire with the new year, made me decide to add another entry to my series of posts evaluating build performance. This time, I'm comparing my desktop PC to the current AWS king of the hill, an i4i.metal instance.

If you don't make a habit of reading EC2 instance specs, the i4i.metal has 128 virtual CPUs (32 actual cores), 1 terabyte of RAM, 30 terabytes of locally-attached SSD storage spread over 8 drives, and 75,000 megabits of network bandwidth. It costs $10.982 per hour ($96,268.212 per year) on-demand in us-east-1. There are more expensive EC2 instance types; the p3dn.24xlarge costs $31.212 per hour, but has fewer vCPUs, less memory, and less disk.

To see if the local SSD offered a performance improvement over EBS, I configured a 1 terabyte gp3 drive as the machine's root volume, and formatted one of the attached SSDs as ext4. I created a separate user, whose home directory was on the SSD, so all of the reads and writes for the builds should have stayed there.

As a comparison, I have my ten-year-old desktop: an i7-3770k (not overclocked) with 32 GB of RAM and a 512 GB Samsung 860 Pro SSD. It cost around $750 to build (no graphics card). I also spun up an m5.large EC2 instance, for consistency with previous tests.

Both of the AWS instances were running Amazon Linux 2; my devbox runs Xubuntu 20.04. All machines ran OpenJDK 1.8, although the specific builds varied (it's whatever the package manager installed). And I manually installed Maven 3.5.4 on all of the machines (it's what I'm running at home).

For a test workload, I built the AWS V2 Java SDK (commit 0f7779ef, corresponding to version 2.19.9-SNAPSHOT). This is a much bigger build than most people will ever deal with: almost 400 sub-projects, and over 100,000 Java files (including tests and generated code). I skipped tests, because it was clear that some of the tests involved timing delays; I wanted to see pure CPU/disk performance.

I ran three builds with each configuration. The first was a “clean” build, forcing Maven to download all dependencies. The second was with empty buffer cache (echo 3 > /proc/sys/vm/drop_caches), and the third, run immediately afterward, should have benefited from any files that were in the cache. As it turned out, the numbers were so close that it didn't make sense to report them separately; all numbers in the table below are from the “empty cache” run (ie, no downloads involved). As with previous tests, I show the output from the Linux time command; the “real” column is the elapsed time of the build, and is what developers care about.

  Real User Sys
My DevBox 27m 24.406s 80m 3.772s 1m 16.792s
m5.large 54m 40.495s 94m 1.207s 1m 46.047s
i4i.metal EBS 17m 49.500s 97m 30.694s 2m 19.089s
i4i.metal SSD 17m 44.165s 97m 6.427s 2m 11.365s

I have to be honest, I was surprised: I expected a small improvement in performance, but not 35%! My guess at the reason for the difference, based on the higher ”user” time, is that it's able to make more effective use of those 32 cores. The 55 MB CPU cache (versus 8MB on my PC) may have helped as well. I think the only way to summarize this test is with the words of Ferris Bueller:

It is so choice. If you have the means, I highly recommend picking one up.

Wednesday, December 14, 2022

Deprecating log4j-aws-appenders

I just made what I hope is the last release of my log4j-aws-appenders library. It started almost six years ago as a "weekend project" to produce a Log4J 1.x appender that wrote output to CloudWatch Logs. It has expanded over the years: I added Kinesis Streams and SNS as destinations, added support for Log4J 2.x and Logback, added support for the AWS 2.x Java SDK, and maintained the code as something I could be proud of.

And other people found it useful: it's received a handful of GitHub stars, and sees around 30,000 downloads a month from Maven Central (overwhelmingly for Log4J 1.x!).

But I think it's outlived its usefulness, and there are better options.

I'll start with an explanation of why I wrote it. At the time, I was working on a project that had around a hundred EC2 virtual machines running pre-baked AMIs, and using the AWS-provided logging agent to write to CloudWatch. The pre-baked AMI meant that everything went to the same log stream: we didn't configure separate streams for separate instances. The agent wasn't (at that time) very good at recognizing the boundaries between log messages, and the multi-threaded nature of our servers meant that messages would be interleaved anyway. Throw in CloudWatch's limited ability to filter messages, and the result was a mess.

As a result, I had two explicit goals for the first release: ensure that a Java LogEvent was written as a single CloudWatch Logs event (including stack traces), and allow different instances to write to different log streams. And this was better, but not great, because it still meant interleaved messages from different threads. So I implemented the Kinesis appender, to send log messages to Elasticsearch. I don't think my boss liked the monthly cost of a six-node Elasticsearch cluster, but the other developers liked the ability to quickly isolate a single web request and all of its related operations.

So why deprecate it? The answer is that the AWS world has moved forward in the past six years. CloudWatch is the default logging destination for Lambda and ECS, and the CloudWatch agent for EC2 has gotten much better. And Insights has made searching CloudWatch much easier, especially if you write log messages in JSON.

So rather than swim against the flow, I recommend that you use CloudWatch Logs rather than my library. For Lambda (and ECS or EKS with the awslogs driver), just write to Standard Error; it will be picked up by the runtime and sent to CloudWatch. For EC2, use the logging agent, configured to parse individual events. If you want to use Elasticsearch, you can use a subscription to get the data out of CloudWatch Logs (something that's become easier with EventBridge Pipes, the topic of an upcoming post). Or you can use an HTTP appender (available in all the major logging frameworks), and wire up your own pipeline using API Gateway's Kinesis integration (something else that wasn't available six years ago).

With all of these options, my library is superfluous. And while I think it's mature, stable, and bug-free, using it exposes your project to the risk of having a single volunteer maintainer responsible for a key part of your infrastructure.

Saturday, May 7, 2022

A Self-Made Bug

Chasing a bug can be one of the most frustrating parts of software development. All you have to start with is an observed behavior. Hopefully you can replicate that behavior. You then have to gather the information needed to understand what caused the bug, which is mostly about ruling out what didn't cause it. With luck, you have the tools (logging, system utilities) that let you do this.

And then, when you figure out what it is and fix it, most of the time your thought is “wow, that was dumb.” It's definitely not the same feeling you get when you finish a challenging feature.

This is the story of me tracking down a bug. I'm writing it as a form of catharsis, but also because I think it illustrates the lengths a developer has to go to to prove that something is a bug. In this case, it wasn't, really, just me doing something dumb and not realizing it.

The story starts with me implementing what I thought would be a simple web service to let a client upload large files to S3. Simple, because I started with an example that I'd written for a blog post. After a couple of hours to convert something intended as a teaching tool into something user-friendly and easy to deploy, and I was ready to test. Some small files went through with no problem, so I selected a 12.5 GB file and went for a bicycle ride.

When I got back, there was no browser running.

The first rule of debugging is that you need to reproduce the bug, so I started the upload again and switched my focus to another task. An hour or so later, I went back to the VM running my test, and again, no browser running.

I started the upload again, and paid careful attention to the requests flowing through the Network tab in the Firefox developer tools. Everything looked good, so I turned to top: when programs die unexpectedly, it's often due to memory errors. Sure enough, I saw that the resident set size (RSS) kept growing.

OK, probably a bug in my code. I'm not much of a JavaScript developer, and don't really understand how it manages memory, so I'm probably holding onto something unintentionally. Fortunately, the code is simple, and I was able to set a breakpoint in a "progress monitor" callback. After digging through various object trees accessible from my code, I was convinced that nothing I did caused the problem.

Time to turn to Google (and Duck Duck Go, which I'm trying as an alternative), to see if maybe there's something wrong with the AWS JavaScript library. I didn't expect to find anything: the second rule of debugging is that when you think there's a problem with a commonly-used library, it's you. But I was using an older version of the library, and perhaps uploading 12 GB from the browser was unusual enough to hit a corner case. Unfortunately, most of the search hits were from Stack Overflow, and were basic “how do I use this library?” questions.

One of the great things about having browsers built by different companies is that you can do comparison tests. I fired up Chrome, started the upload, and watched top; no change in its RSS, and the overall available memory remained constant. I started a Windows VM and did the same thing with Edge, and while the Windows Task Manager doesn't give the level of information that top does, it also appeared to handle the upload without a problem.

More Googling, now on Firefox memory issues. And from that, I learned about about:memory, which lets you see the memory usage of every Firefox process. With that page open in one window, I started my upload from another. After a gigabyte or so of the upload, I checked the memory dump … and it didn't show any excess memory consumption. Neither did top. WTF?!?

At this point it hit me: every time the browser crashed, I had Developer Tools open. So the browser was holding onto every chunk of the file that it uploaded, in case I wanted to go to the Network tab to inspect those requests.

Is there a lesson here? Not really; it's just an example of following the process I first wrote about a dozen years ago. But as I said, it's catharsis, and a reminder that most problems are PEBKAC: Problem Exists Between Keyboard And Chair.

Thursday, February 24, 2022

Leveraging try-with-resources to manage the mapped diagnostic context

The mapped diagnostic context is an under-appreciated feature of logging libraries. It's essentially a thread-local Map, to which you add key-value pairs that provide context about what your program is doing. Here's a trivial example:

logger.info("program starting");
File file = new File(argv[0]);

MDC.put("outputFile", file.getAbsolutePath());

try (FileOutputStream fos = new FileOutputStream(file);
        OutputStreamWriter osr = new OutputStreamWriter(fos, StandardCharsets.UTF_8);
        BufferedWriter out = new BufferedWriter(osr))
{
    logger.info("starting to write");
    out.write("hello, world");
    out.newLine();
    logger.info("finished writing");
}

MDC.remove("outputFile");
logger.info("program finished");

When you run this program, using a logging config that outputs the MDC, you'll see something like this:

2022-02-23 07:28:01,673 INFO  [main] c.kdgregory.example.Main -  - program starting
2022-02-23 07:28:01,677 INFO  [main] c.kdgregory.example.Main - outputFile=/tmp/test.txt - starting to write
2022-02-23 07:28:01,677 INFO  [main] c.kdgregory.example.Main - outputFile=/tmp/test.txt - finished writing
2022-02-23 07:28:01,677 INFO  [main] c.kdgregory.example.Main -  - program finished

Web-apps can benefit enormously from the MDC: before processing the request, you extract things like the invoking user, request path, session token, or a unique request ID. This makes it easier to track down problems, because you can filter the log by any of those parameters.

But I've recently been doing a lot of data engineering work: reading files or database tables, performing some transformation on them, and sending them to some destination. These tasks tend to be complex, with multiple steps, and they tend to be performed for multiple files or tables at a time. As with a web-app, it's really nice to add contextual information such as table name and selection criteria to the MDC, and let the logging framework write it with every message.

The problem with the MDC is that every put() has to be paired with a remove(). If you forget to remove a key it will “pollute” every subsequent log message from that thread, giving you potentially misleading information.

However, one thing that I noticed is that I tend to set the MDC just before a try-with-resources block. Or inside a loop that calls one or more functions that could be wrapped in such a block. This led me to the AutoMDC class:

logger.info("program starting");
File file = new File(argv[0]);

try (AutoMDC mdc = new AutoMDC("outputFile", file.getAbsolutePath());
        FileOutputStream fos = new FileOutputStream(file);
        OutputStreamWriter osr = new OutputStreamWriter(fos, StandardCharsets.UTF_8);
        BufferedWriter out = new BufferedWriter(osr))
{
    logger.info("starting to write");
    out.write("hello, world");
    out.newLine();
    logger.info("finished writing");
}

logger.info("program finished");

Try-with-resources works with classes that implement java.lang.AutoCloseable: an interface that declares the close() method. My AutoMDC class implements this interface, and uses a Set<String> to keep track of the keys. It provides two methods (and the “convenience” constructor shown above):

public AutoMDC put(String key, Object value)
{
    keys.add(key);
    MDC.put(key, String.valueOf(value));
    return this;
}

@Override
public void close() throws Exception
{
    for (String key : keys)
    {
        MDC.remove(key);
    }
}

That's it: you can add items to the MDC in the try-with-resources initializer, or anywhere inside the try block itself, and they'll be removed at the end. One downside is that the close() method is called before any catch or finally blocks; if you need to log contextual information in those places, you'll need to do it manually.

If you'd like to use this in your own programs, I've provided an implementation for Logback as a GitHub gist; the same basic code can be adapted to whichever logging framework you use.

I think the idea of leveraging try-with-resources is a useful one for other situations, especially those where you might otherwise turn to aspect-oriented programming. Plus, it encourages the good habit of wrapping your code in try/catch blocks.

Saturday, December 18, 2021

My take on the Log4J 2.x vulnerability

A week ago, a lot of Java application developers learned that their applications harbored a severe vulnerability, courtesy of the Log4J 2.x logging framework. The vulnerability, CVE-2021-44228 allowed execution of arbitrary code on any system that logged unsanitized user input using the Log4J 2.x library. This prompted a lot of people to scramble to protect their systems, and a lot of people to take to Twitter with opinions of What It All Means.

As the maintainer of an open-source library that integrates with Log4J, I spent my Saturday morning understanding the bug and updating my examples to use versions of the library that mitigated the problem. Fortunately, my library is not directly affected, as long as its consumers don't use unsanitized data to configure the logging framework.

Having done that, and reading as much as I could on the issue (the LunaSec writeups are excellent), I've decided to voice my own thoughts on the matter. Some of which I haven't seen other people say, so they may be similarly interesting to you.

First, I think that it's important to recognize that this vulnerability — like most things that end up in the news — is not the result of a single issue. Instead, it's a combination of features, some of which make perfect sense:

  1. Log4J 2.x provides string interpolation for configuration (aka “lookups”)

    This is a great idea; I implemented it for my own logging library. The idea is that you don't want your configuration files to contain hardcoded values, such as the address of your central syslog daemon (or, in my case, the name of a CloudWatch log group). Log4J 2.x provides a long list of lookups, ranging from environment variables to information from the Docker container running your application.

  2. One of the lookups retrieves data from the Java Naming and Directory Interface (JNDI) API

    In large deployments, it's nice to be able to centralize your configuration. There are lots of tools to do this, but Java Enterprise Edition settled on JNDI, also known as the javax.naming package. JNDI is an umbrella API for retrieving data from different sources, such as LDAP.

  3. javax.naming.spi.ObjectFactory supports loading code from a remote server

    This is a somewhat dubious idea, but the JNDI SPI (service provider interface) spec justifies it: it lets you defined resources (such as printer drivers) that can be retrieved directly from JNDI. They use the example of a printer driver, and it should be a familiar example to anyone who has installed a printer on their home computer (do you know that the driver you installed is trustworthy?).

    Note: this condition is necessary for remote-code execution, but not for data exfiltration.

  4. The Log4J 2.x PatternLayout also supports string interpolation, with the same set of lookups

    Here we're getting into questionable features in the library. I had no idea that this behavior existed, even though I dug deeply into the documentation and source code when implementing my appenders. The documentation for this layout class is quite long, and prior to the vulnerability, you had to infer the behavior based on the presence of the nolookups pattern option.

  5. Users log unsanitized data

    If users passed all of their logging messages through a sanitizer that looked for and removed the sequence ${, then the vulnerability wouldn't exist. Except nobody does that, because why would you have to? I call it out because I think it's important to consider what you're logging, and whether it might contain information that you don't want to log. As I say in my “effective logging” talk, passwords can hide in the darndest places.

These are the things that need to happen to make this vulnerability affect you. If you can prevent one of them from happening, you're not vulnerable … to this specific issue. And there are ways to do this, although they aren't things that you can easily implement once the vulnerability is discovered. I'm writing a separate post on how Cloud deployments can mitigate similar vulnerabilities.

For now, however, I want to focus on two of the responses that I saw online: pay for open-source maintainers, and inspecting code before using it. In my opinion, neither of these are valid, and they distract from preparing for the next serious vulnerability.

Response #1: inspect code before you use it.

For any non-trivial application, this is simply impossible.

The current “trunk” revision of log4j-core has 89,778 lines of code, excluding test classes (measured using find and wc). That doesn't count any add-on libraries that you might use to write to your preferred destination, such as my log4j-aws-appenders (which has over 10,000 lines of mainline code). And logging is a tiny part of a modern application, which is typically built using a framework such as Spring, and runs on an application server such as Tomcat or Jetty.

And even if your company is willing to pay for the staff to read all of that source code, what is the chance that they will discover a vulnerability? What is the chance that they will even learn all of its behaviors? I've spent quite a bit of time with the Log4J 2.x code and documentation, both to write my library and on a post describing how to write Log4J plugins, and I never realized that it applied string interpolation to the raw log messages. After I knew about the vulnerability, of course, it was easy to find the code responsible.

Response #2: we — or at least large companies — should be paying the maintainers of open-source projects.

I don't know the situation of the core Log4J developers, and whether or not they get paid for their work on the project. But I don't believe that this vulnerability was the result of an overworked, unpaid, solo developer. True, there was no discussion on the commit that introduced JNDI lookups (ignoring the tacky post-hoc commenters). But the code that applies string substitution to logging events has been in the library since the 2.0 release, and has been rewritten multiple times since then.

In fact, I think direct corporate sponsorship would lead to more unexpected behavior, because the sponsoring corporations will all have their own desires, and an expectation that those desires will be met. And if my experience in the corporate world is any guide, a developer that feels their paycheck is in jeopardy is much more likely to do something without giving it full thought.

So where does that leave us?

Unfortunately, I haven't seen very many practical responses (although, as I said, I'm writing a separate post to this effect). And I think that the reason for that is that the real answer puts the onus for vulnerabilities on us, the consumers of open-source software.

Linus's Law, coined by Eric S Raymond, is that “given enough eyeballs, all bugs are shallow.” And this played out in full view with this vulnerability: the Log4J team quickly found and patched the problem, and has been releasing additional patches since.² There have also been multiple third-parties that have written detailed evaluations of the vulnerability.³

But still, we, the consumers of this package, needed to update our builds to use the latest version. And then deploy those updated builds. If you didn't already have a process that allows you to quickly build and deploy a hotfix, then your weekend was shot. Even if you did get a hotfix out, you needed to spend time evaluating your systems to ensure that they weren't compromised (and beware that the most likely compromise was exfiltration of secrets!).

It's natural, in such circumstances, to feel resentment, and to look for external change to make such problems go away. Or maybe even to think about reducing your reliance on open-source projects.

But in my opinion, this is the wrong outcome. Instead, look at this event as a wake-up call to make your systems more robust. Be prepared to do a hotfix at a moment's notice. Utilize tools such as web application firewalls, which can be quickly updated to block malicious traffic. And improve your forensic logging, so that you can identify the effects of vulnerabilities after they appear (just don't log unsanitized input!).

Because this is not the last vulnerability that you will see.


1: You might be interested to learn that the Apache Software Foundation receives approximately $3 million a year (annual reports here). However, to the best of my knowledge, they do not pay stipends to core maintainers. I do not know how the core Log4J 2.x maintainers earn their living.

2: Log4J 2.x change report.

3: I particularly like the CloudFlare posts, especially the one that describes how attackers changed their payloads to avoid simple firewall rules. This post informed my belief that the goal of most attacks was to exfiltrate secrets rather than take over systems.

Wednesday, July 14, 2021

My take on "How to re:Invent"

It's back. AWS is taking over Las Vegas for a week filled with information, sales pitches, and corporate-friendly activities. And while COVID and the possibility of a “fourth wave” hang over the conference, I decided to sign up. Having been to re:Invent once, I now consider myself an expert on how to survive the week. Here are five of my suggestions.

#1: Wear comfortable shoes.
OK, everybody says this, but it bears repeating: you're going to do a lot of walking. It might take ten minutes to navigate from the front door of a hotel to the meeting rooms, following a labyrinthine path through the casino. To give you some numbers: my watch recorded 87,000 steps, or 44.6 miles, over the five days of the conference. That may be higher than average: I often walked between venues rather than find my way to the shuttle buses. But even if you “only” walk 30 miles, you'll still be thankful for doing it in a pair of running shoes.
#2: Stay in a “venue” hotel.
These are the hotels that host sessions and other sponsored content, as opposed to the “sleeping” hotels that just have rooms for attendees. There are several reasons to stay at a venue hotel, but in my opinion the most important is that it cuts down on the amount of walking that you have to do. Of my 87,000 steps, I estimate that 10,000 or more were taken up in walking from my room at the Park MGM to the Aria so that I could pick up a shuttle bus.
#3: Attend workshops, not sessions.
There are some great sessions at re:Invent, conducted by people who are intimately familiar with the service. If you have specific questions it's worth attending one of the “deep dives” and then walking up to the speaker afterward to ask those questions.

But, all of these sessions will be recorded, and you can watch them at your leisure. So if you don't have specific questions there's no reason to attend in-person. What you can't do after December 3rd is learn with an AWS instructor by your side (well, not for free anyway). Unfortunately, space for these workshops is limited, so sign up early for the ones you want (that said, scheduling at re:Invent is extremely fluid; at least half the sessions I attended were marked as full but then had spots open up an hour before they started).

#4: Fly out on Saturday.
If you're not from the United States, you may not realize that re:Invent takes place during the week after the Thanksgiving holiday. Thanksgiving is a time when people return home to visit family and friends, and then all of them get on a plane the following Sunday to return home. It's historically the busiest travel day of the year, and US airports are crowded and frantic with people who only fly on that weekend. Plus, airlines charge the highest rates of the year, because they know people will pay. Even if you have TSA/Pre, it's not fun.

If you're willing to fly out a day early, you avoid the crowds. Plus, you can save significantly on the airfare (right now, it would save me over $300, or nearly 50%). Against that, you'll be paying for an extra night in Vegas. For me, with the conference rate for the hotel, the numbers worked.

#5: Get out of Vegas.
For some people, Vegas is a destination: they love the lights, the noise, and the constant activity. For me, it's overwhelming. Fortunately, you can find thousands of square miles of absolute desolation just outside city limits.

Last time, I rented a motorcycle for a day and explored nearby attractions: Valley of Fire, Hoover Dam, and Red Rock Canyon. This year, I'm planning to take three days and explore southern Utah and northern Arizona. If you're not a motorcyclist, Vegas also has plenty of rental cars, including exotics. And at the far end of the scale, you can spend a day in a high-performance driving class at the Las Vegas Motor Speedway.

Well, that's it. Now it's time to cross my fingers and hope the US COVID situation remains under control.

Tuesday, June 8, 2021

An open letter to the AWS Training organization

You don't have a Feedback link on your site, but it seems that Amazon keeps close tabs on the Blogosphere, so hopefully this reaches you.

I don't know whether you're an actual sub-division of Amazon, but the website URL https://www.aws.training certainly didn't give me a warm fuzzy feeling when it came up in Google. In fact, my first thought was that it was some unaffiliated company that had better SEO.

So, since it was asking me for login credentials, I did what any reasonably cautious technologist would do, and ran whois. And this is what I got back:

Domain Name: aws.training
Registry Domain ID: 8d519b3def254d2f980a08f62416a5b9-DONUTS
Registrar WHOIS Server: whois.comlaude.com
Registrar URL: http://www.comlaude.com
Updated Date: 2019-05-19T19:54:24Z
Creation Date: 2014-03-19T00:32:11Z
Registry Expiry Date: 2024-03-19T00:32:11Z
Registrar: Nom-iq Ltd. dba COM LAUDE
Registrar IANA ID: 470
Registrar Abuse Contact Email: abuse@comlaude.com
Registrar Abuse Contact Phone: +44.2074218250
Registrant Name: REDACTED FOR PRIVACY
Registrant Organization: Amazon Technologies, Inc.
Registrant Street: REDACTED FOR PRIVACY
Registrant City: REDACTED FOR PRIVACY
Registrant State/Province: NV
Registrant Postal Code: REDACTED FOR PRIVACY
Registrant Country: US
Registrant Phone: REDACTED FOR PRIVACY
Registrant Phone Ext: REDACTED FOR PRIVACY
Registrant Fax: REDACTED FOR PRIVACY
Registrant Fax Ext: REDACTED FOR PRIVACY
Registrant Email: Please query the RDDS service of the Registrar of Record identified in this output for information on how to contact the Registrant, Admin, or Tech contact of the queried domain name.

That's the sort of whois entry that you get for an individual using a shared hosting service. In fact, it provides less information than you'll see with my domain, which runs on a shared hosting service, and I pay extra for privacy.

By comparison, the whois entry for Amazon itself looks like this (and note that it's a different registrar, another red flag):

Domain Name: amazon.com
Registry Domain ID: 281209_DOMAIN_COM-VRSN
Registrar WHOIS Server: whois.markmonitor.com
Registrar URL: http://www.markmonitor.com
Updated Date: 2019-08-26T12:19:56-0700
Creation Date: 1994-10-31T21:00:00-0800
Registrar Registration Expiration Date: 2024-10-30T00:00:00-0700
Registrar: MarkMonitor, Inc.
Registrar IANA ID: 292
Registrar Abuse Contact Email: abusecomplaints@markmonitor.com
Registrar Abuse Contact Phone: +1.2083895770
Registrant Name: Hostmaster, Amazon Legal Dept.
Registrant Organization: Amazon Technologies, Inc.
Registrant Street: P.O. Box 8102
Registrant City: Reno
Registrant State/Province: NV
Registrant Postal Code: 89507
Registrant Country: US
Registrant Phone: +1.2062664064
Registrant Phone Ext: 
Registrant Fax: +1.2062667010
Registrant Fax Ext: 
Registrant Email: hostmaster@amazon.com

While I'm a little surprised by the Reno address, rather than Seattle, this at least looks like the sort of registration information used by a business rather than somebody who pays $10/month for hosting.

I ended up getting to the training site via a link on the AWS Console, so was able to achieve my goal.

But I think there's a general lesson: don't forsake your brand without good reason.

And at the very least, ask your network administrators to update your whois data.